I. Market Overview
Data scope:As of 2026-7-23 08:55 (UTC+8), BTC/USDT was quoted at 66,023.80 USDT, down 0.85% over the past 24 hours. The range high and low were 66,629.30 and 65,505.00 USDT, respectively, with volume of approximately 116,355 BTC. The price pullback was limited, but repeated approaches to the upper end of the range failed to continue, indicating that support at elevated levels remains while willingness to chase prices is unstable. The current pattern looks more like consolidation after a rise than a one-way acceleration; readers should monitor both range boundaries and changes in trading volume.
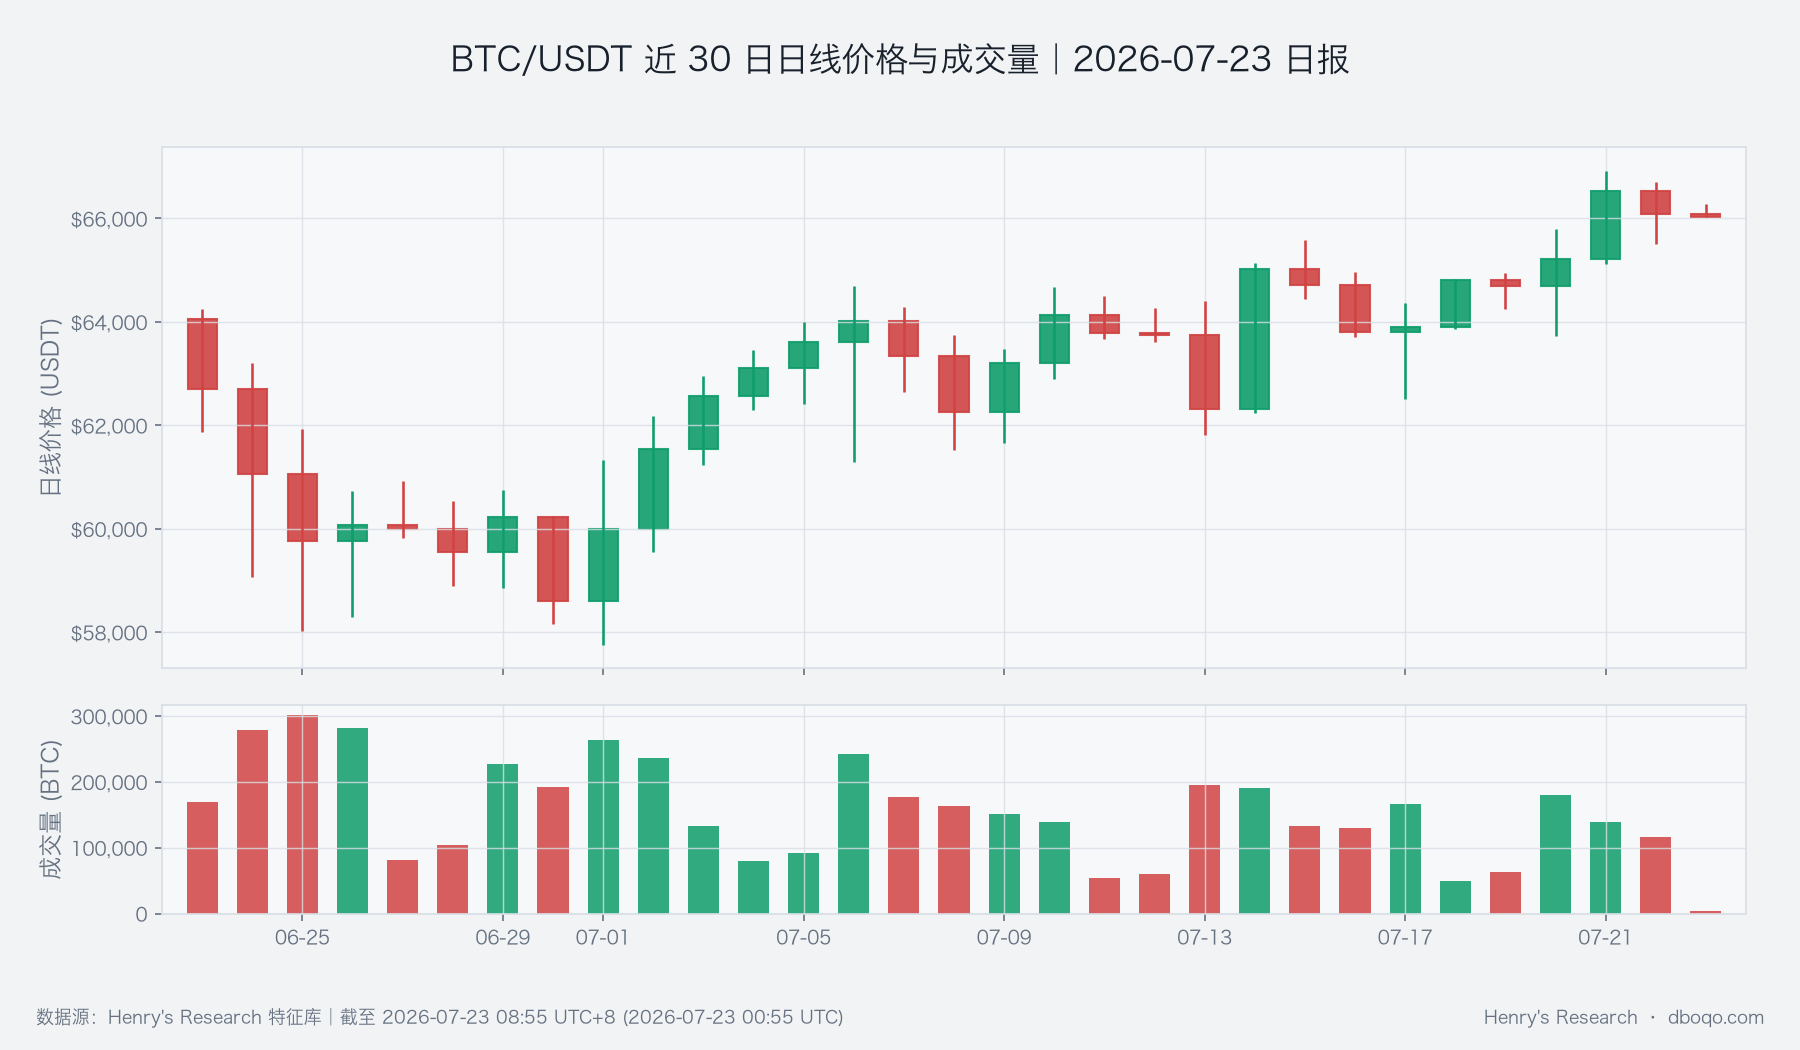 BTC/USDT Daily Price and Volume Over the Past 30 Days
II. Technical Indicators
Price remains above the 10-day moving average of 64,708.46 and the 30-day moving average of 62,812.28 USDT, maintaining an upward short- to medium-term structure. The daily strength indicator is 59.13, not yet in a clearly overheated zone, and the trend-momentum indicator also remains positive. In contrast, the intraday strength indicator has fallen to 45.15, indicating that the short-term buyer advantage has weakened. Average daily volatility is approximately 1,541.47 USDT, meaning intraday swings may still be substantial even if the directional view remains unchanged. If price continues to hold above the short-term moving average, there may still be room to extend after consolidation; if it breaks below with expanding volume, the credibility of technical support will decline.
III. Derivatives and Capital Flows
The perpetual funding rate is -0.0003%, the futures premium is approximately -0.06%, and open interest declined by 2.09% within 24 hours. This indicates no clear crowded momentum chasing in the derivatives market, with some risk exposure contracting. The long/short trader ratio is 1.19, suggesting slightly optimistic sentiment, but the active buy-sell slope is -57.65 BTC, indicating that sellers remain more active in actual trading. Lower funding can reduce overheating risk, but it does not automatically mean buying has strengthened; only when open interest stabilizes and active buying improves in tandem will derivatives signals truly turn supportive of further upside.
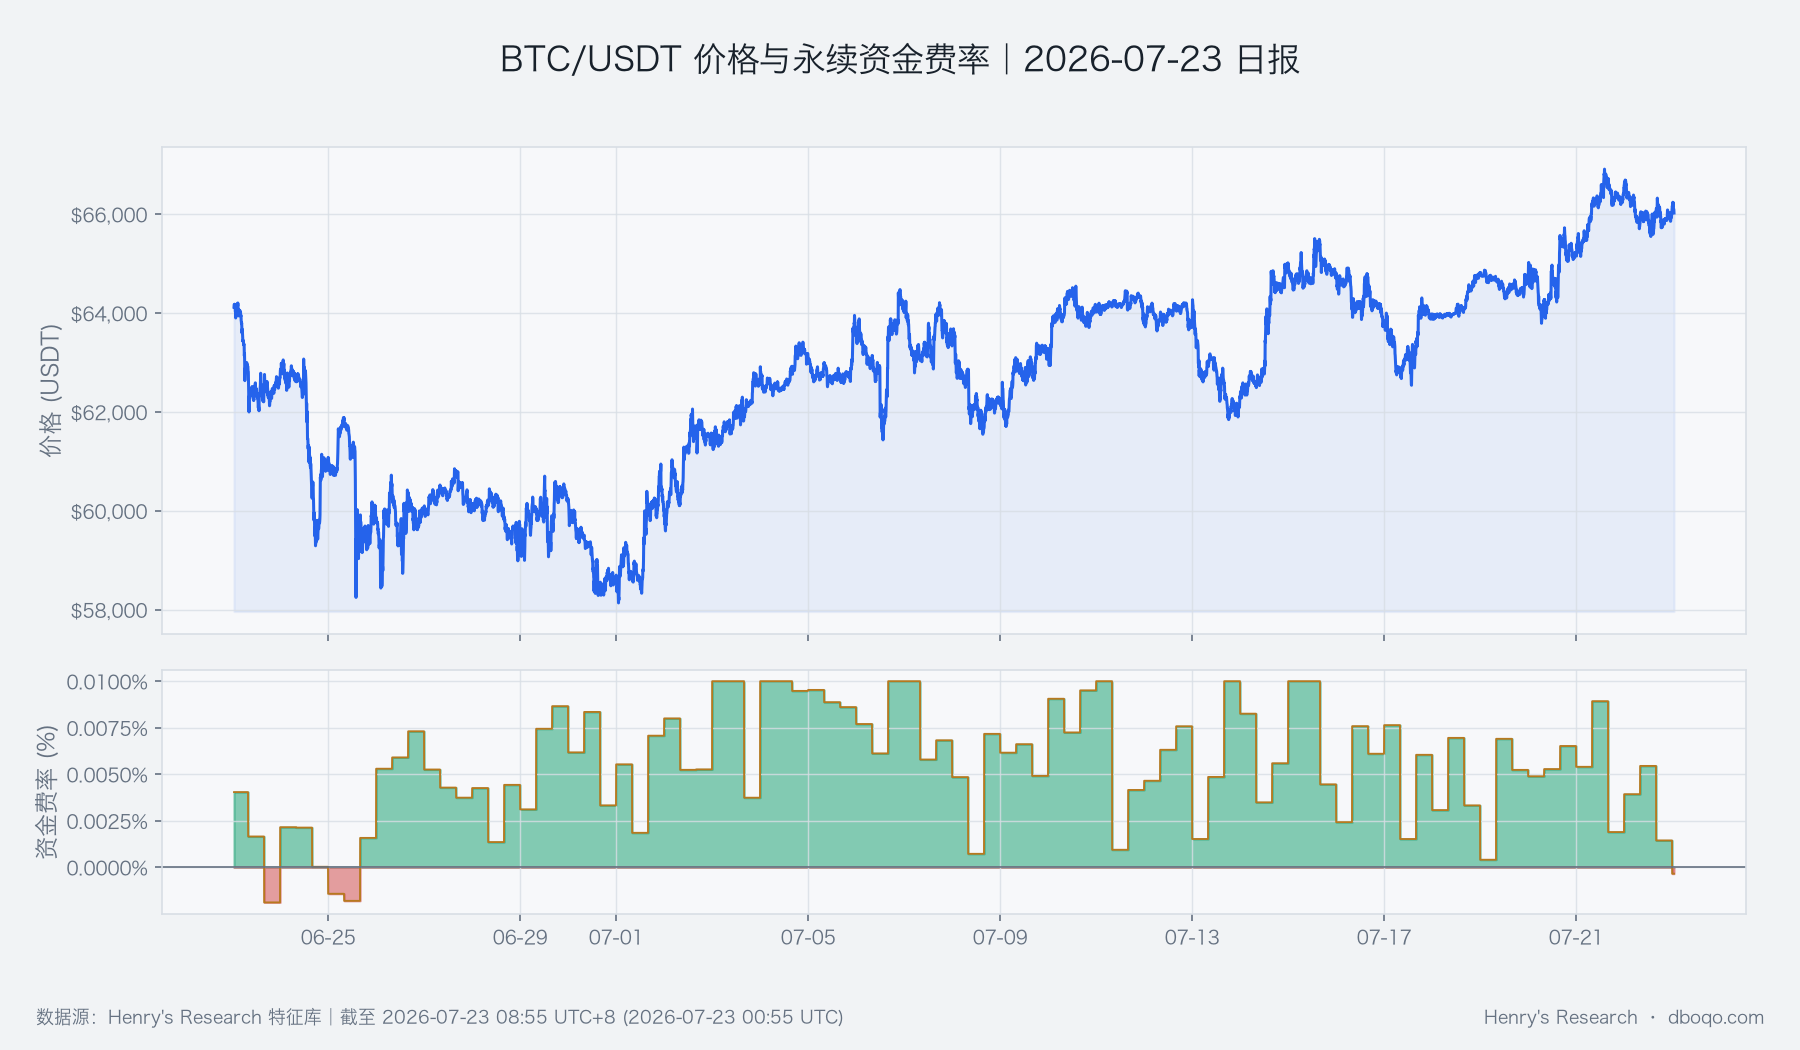 BTC/USDT Price and Perpetual Funding Rate Over the Past 30 Days
The daily quantity proxy for the covered BTC perpetual markets is 154.219 BTC, with a cumulative 16,579.780 BTC over the past 30 days. The current single-day reading is not notable relative to the cumulative scale, indicating that recent volatility has not been accompanied by unusually concentrated passive liquidations. Together with low funding and falling open interest, it points to cooling derivatives activity; however, this proxy covers only specific markets and uses a daily-frequency basis, so it cannot be extrapolated to real-time conditions across all markets.
IV. Cross-Market Environment
ETFs recorded net inflows of 7.03 billion USD over the past 5 days, providing positive off-exchange capital-market conditions for price. Stablecoin supply increased slightly by 0.04% over the past 7 days, but still contracted by 1.40% over the past 30 days, indicating that the short-term marginal improvement has not reversed medium-term liquidity pressure. The U.S. Dollar Index is 101.17, and the volatility index is 17.63, with the risk environment showing no extreme stress. BTC's 30-day correlation with U.S. equities is only 0.0622, indicating weak current linkage. Therefore, ETF inflows are more appropriately treated as a supportive condition rather than a deterministic explanation for price direction.
V. Overall Assessment
The central tension is that price remains above both daily moving averages and ETF flows remain positive, while active selling pressure, declining open interest, and medium-term stablecoin contraction limit the quality of an upside breakout. The dominant evidence remains that the price structure has not been damaged, while downside risk comes from the lack of resonance in trading volume and derivatives activity. At this stage, the range low near 65,505, the range high near 66,629, and whether active buying improves should be used as validation clues, rather than inferring the trend from a single capital-flow indicator alone.
Directional view:Range-bound. This is a conditional conclusion based on current evidence: the moving-average structure and ETF inflows provide support, but active selling pressure and cooling derivatives activity leave short-term breakouts without confirmation.
Assessment horizon:The next 1–3 days.Conditions for validity:Price holds near 65,505 and remains above the 10-day moving average, volume does not contract excessively, and active buying gradually improves.Invalidation conditions:Price breaks below the range low and the 10-day moving average on expanding volume, or capital flows weaken while selling pressure continues to expand; conversely, if price breaks above 66,629 on expanding volume and derivatives activity recovers moderately, the range-bound view will also be invalidated and shift toward a stronger structure.
VI. Risk Disclosure
Current average daily volatility is relatively high, and reaching both ends of the range within a short period is not unusual. ETFs, stablecoins, the dollar environment, and derivatives data update at different frequencies and may temporarily diverge from one another; a single change may also be revised by subsequent data. Readers should use sustained consistency across multiple data families as confirmation and remain alert to price jumps caused by sudden macro news, rapid liquidity contraction, and expanding trading volume.
Disclaimer:All data in this report are sourced from dboqo feature library, as of 2026-07-23 08:55 UTC+8. Cryptocurrency markets are highly volatile, and this report is solely an objective analysis of market conditions;does not constitute any investment advice; investors must assess risks independently and make prudent decisions.