I. Market Overview
Data methodology:As of 2026-07-25 08:55 UTC+8, BTC/USDT was quoted at 64,049.60 USDT, down 1.39% over the past 24 hours, with a trading range of 63,666.00 to 65,780.00 USDT and volume of approximately 149,197 BTC. After retreating from the upper end of the range, the price is approaching the lower end, indicating that short-term selling pressure remains, although there is not yet confirmation of a downside break from the range. Readers should first watch whether buying support can continue to emerge near 63,666, and whether trading activity improves in tandem during any rebound.
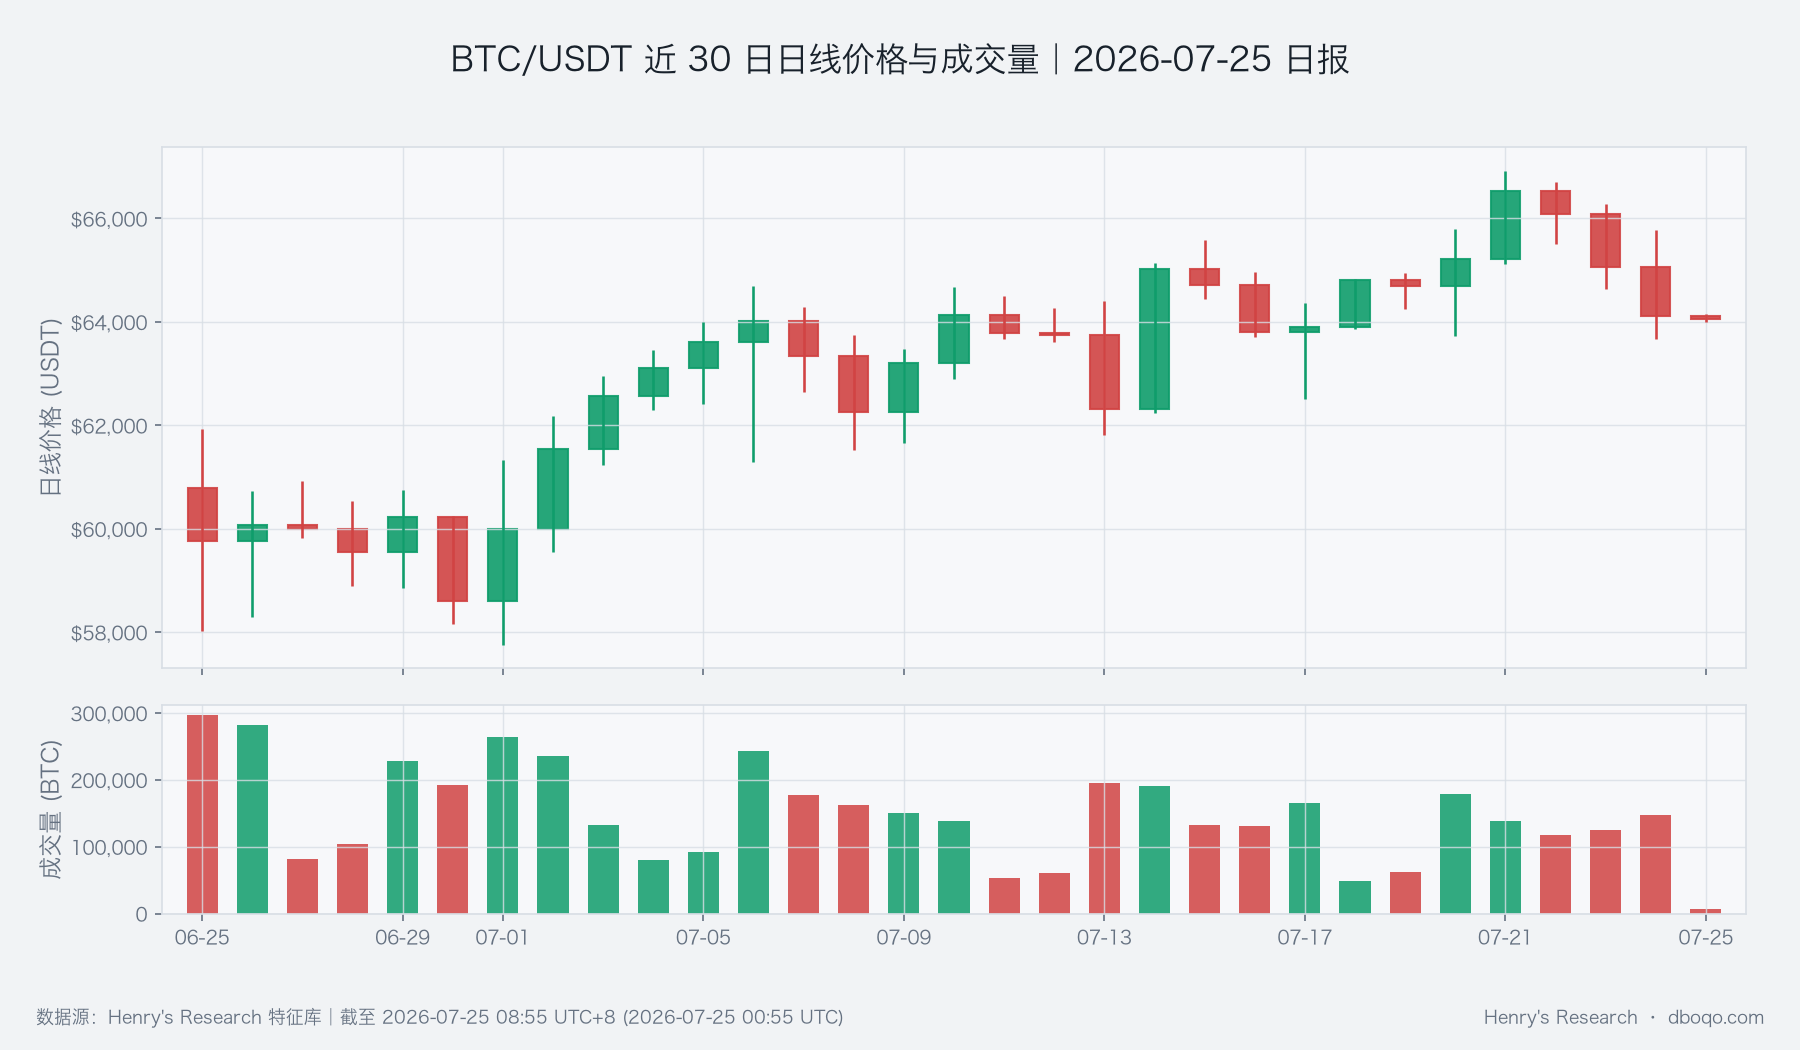 BTC/USDT daily price and volume over the past 30 days
II. Technical Indicators
The daily price is below the 10-day moving average of 64,894.90 USDT, but remains above the 30-day moving average of 62,993.55 USDT, creating an in-between structure of short-term weakness with longer-cycle support still intact. Daily RSI is 49.46, in neutral territory, and the MACD histogram remains positive, meaning the medium-term recovery has not been fully damaged; meanwhile, the 5-minute RSI has fallen to 30.45, approaching the weak side in the short term. The two timeframes are inconsistent, so a single sharp rebound is insufficient to prove a trend recovery. More important is whether price can reclaim and hold above the 10-day moving average.
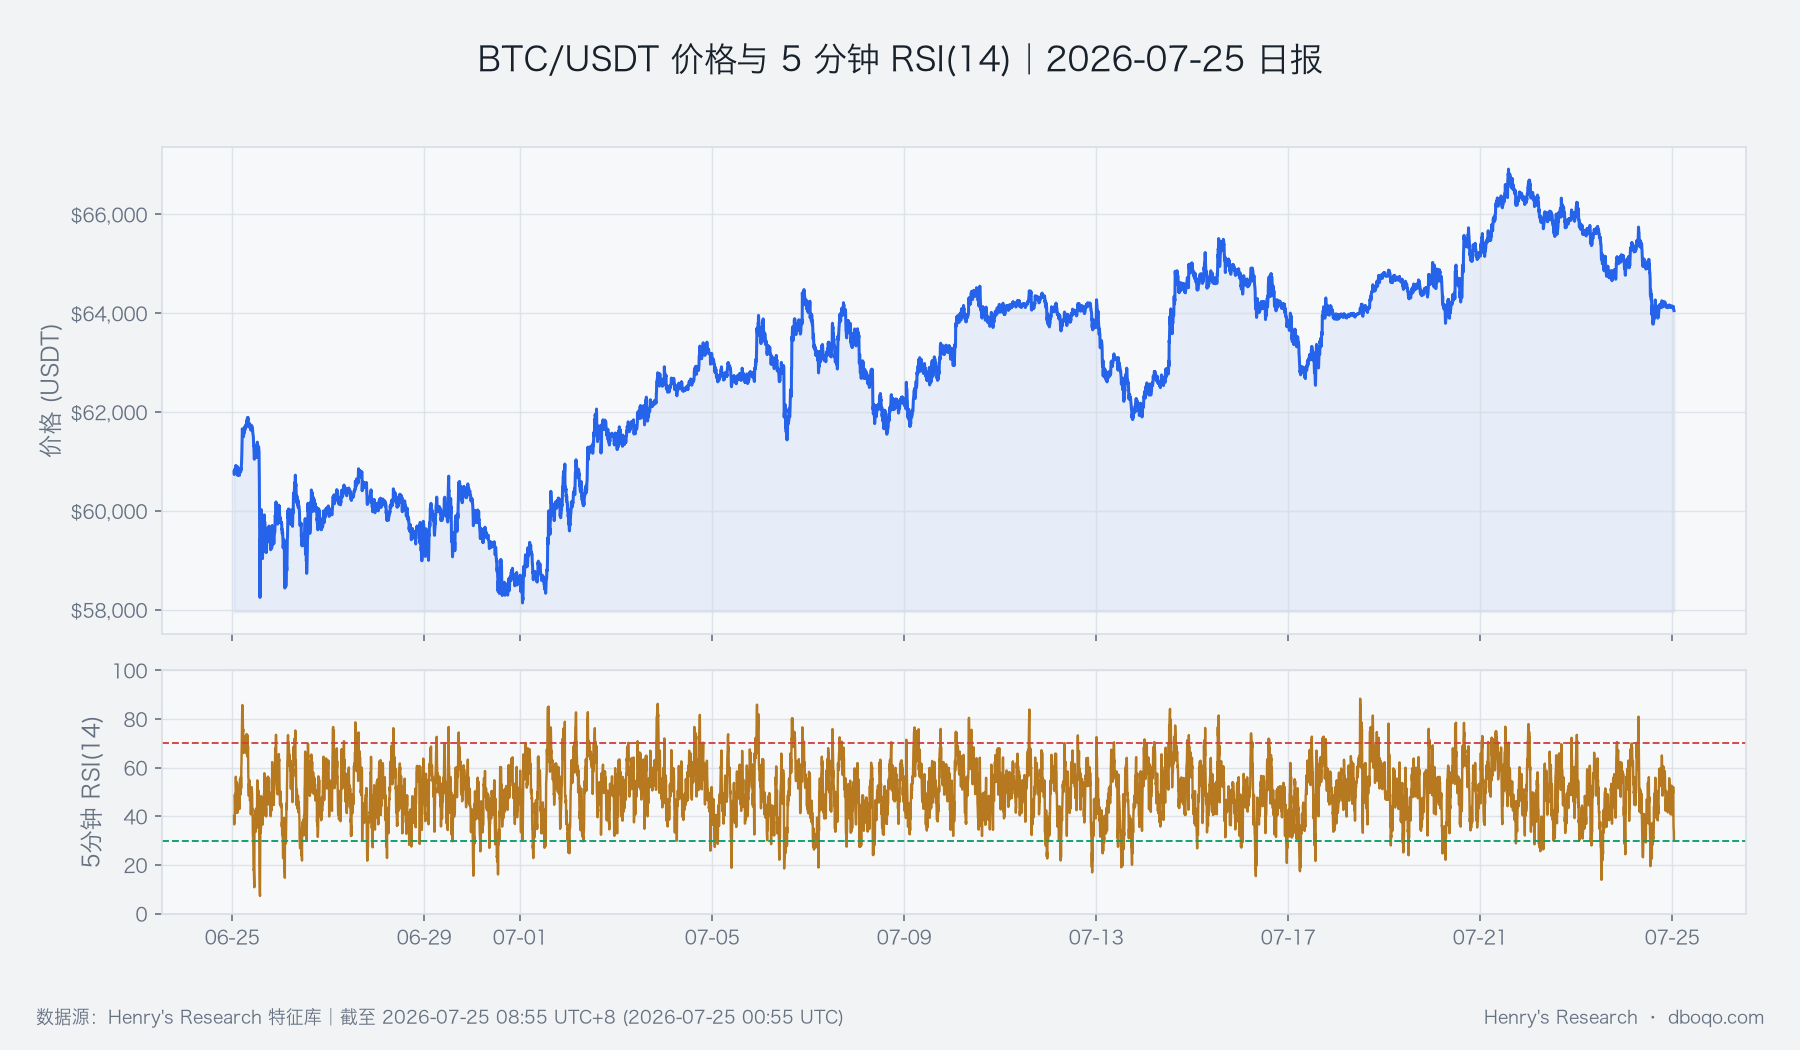 BTC/USDT price and 5-minute RSI(14) over the past 30 days
The 14-day average true range is approximately 1,552.91 USDT, indicating that intraday swing potential remains substantial. The current price is not far from the 24-hour low. Weak short-term indicators may bring a technical recovery, but elevated volatility will also amplify moves after support breaks. When assessing strength or weakness, price position and volume should be considered together: a rebound on shrinking volume is more likely sentiment repair, while reclaiming key moving averages on expanding volume is more sustainable.
III. Derivatives and Capital Flows
The derivatives funding rate is +0.0061%, the long-short ratio is 1.86, and derivatives open interest has increased by 1.49% compared with 24 hours ago, while price fell over the same period. Rising participation without stronger prices suggests new trading is more likely intensifying short-term positioning battles; if the lower end of the range breaks, the risk of a concentrated adjustment will rise accordingly. Meanwhile, the basis is -0.07%, showing no clear premium from chasing prices higher; the market is not unidirectionally optimistic.
The net active-trade flow slope is 20.71 BTC, indicating some active buying support during the pullback and a slight divergence from the price decline. ETFs recorded net inflows of 2.74 billion USD over the past 5 days, which can provide a conditional buffer for risk appetite; however, stablecoin supply declined 0.07% over the past 7 days and 1.20% over the past 30 days, reflecting continued contraction in broader on-exchange liquidity. The daily volume proxy for covered BTC perpetual markets is 292.967 BTC; readers should treat it as a pressure thermometer, not as the total of real-time events across the entire market.
IV. Cross-Market Environment
The U.S. Dollar Index is 101.45, and the volatility index is 18.88. The external environment has not entered an extreme risk-off state, but neither has it formed a clear tailwind for risk appetite. The 30-day correlation coefficient between BTC and the S&P 500 is only 0.0047, with recent linkage close to neutral, meaning that daily moves in traditional risk assets have limited explanatory power for BTC. Whether ETF inflows translate into sustained buying needs confirmation alongside price reclaiming moving averages and a slowdown in stablecoin contraction; price direction cannot be inferred from ETF flows alone.
V. Overall Assessment
The dominant tension is pressure created by the short-term price pullback and warming derivatives participation, while improving active buying, returning ETF flows, and the 30-day moving average still provide a buffer. The evidence better supports repeated digestion within the range rather than an immediate one-way move; below, watch buying support near 63,666 and the 30-day moving average, while above, first watch whether the area near 64,894 can shift from resistance to support.
Directional view:Range-bound. This is a conditional conclusion based on price structure, active trading, and capital-flow evidence; short-term selling pressure still sets the pace, while active buying support and ETF inflows provide an offsetting buffer and do not represent a certain forecast.
Assessment horizon:The next 1–3 days.Conditions for validity:Price holds near 63,666 and gradually reclaims 64,894, with improving volume during the rebound and sustained positive active buying.Invalidation conditions:Price breaks below 63,666 on expanding volume and approaches the 30-day moving average, or derivatives participation continues to increase while active buying support weakens; if price holds above 65,780 on expanding volume, the current range-bound assessment must also be revised upward.
VI. Risk Disclosure
When short-cycle indicators approach weak territory, price may rebound quickly or continue probing lower amid contracting liquidity; both paths may be amplified by elevated intraday volatility. ETFs, stablecoins, and cross-market correlations all differ in update frequency and coverage. Multiple signals should be confirmed together to avoid interpreting a single data change as inevitable causality.
Disclaimer:All data in this report are sourced from dboqo Feature Store, as of 2026-07-25 08:55 UTC+8. Cryptocurrency markets are highly volatile. This report is only an objective analysis of market phenomena and does not constitute any investment advice, and investors must independently assess risks and make prudent decisions.