BTC's gain over the past 24 hours widened from 0.51% in the previous daily report to 1.04%, and trading recovered from an unusually quiet session. Yet active trading still favors sellers, while price has not held above its 10-day average. This improvement in price and volume matters, but it does not yet show a durable base for the rebound. Our view for the next 24 hours is bearish. The question is whether renewed trading becomes sustained buying, rather than simply another day of rising prices.
Trading recovers, but the larger gain still lacks durable support
BTC stood at 83,829.90 USDT, up 1.04% over the past 24 hours, versus 0.51% in the previous report. Volume reached 65,487 BTC, well above yesterday's 35,425 BTC. That is the strongest counterpoint to a bearish view: the market is no longer nearly stalled. Even so, the historical average for comparable periods is 147,511 BTC, so current trading is still less than half that level and below about 89% of 180 comparable periods. Better participation gives the rebound room to continue, but a single gain with trading still below normal does not show that more buyers will follow. Price touched 84,180.00 USDT before moving back below its 10-day average of 84,113.63 USDT. Failing to hold that level weakens the case for a sustained advance.
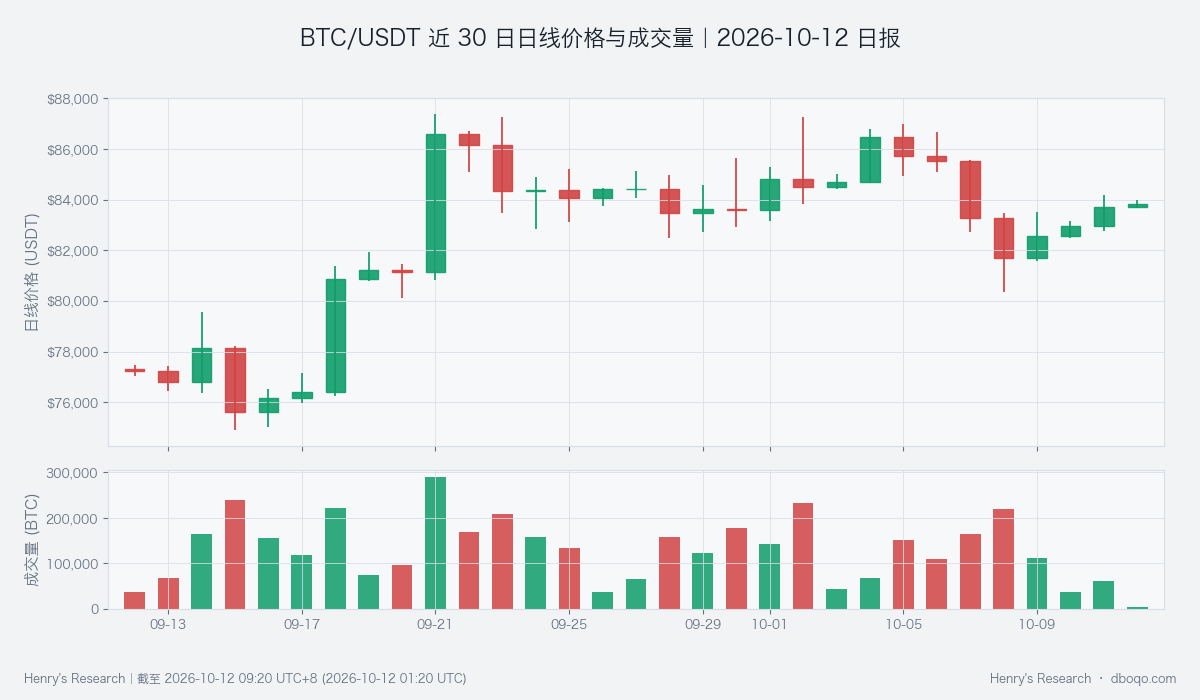
Price gains and trading both improved, but volume remains below its comparable norm.
Active selling persists while the rebound struggles to hold
With more trading, it matters which side is driving it. The recent trend in active buying minus active selling was about negative 76 BTC, against a historical average of about negative 2 BTC, and lower than roughly 75% of comparable periods. Recent selling therefore remains stronger than buying, even as price rises. Short-term volatility also increased from yesterday's 0.03% to about 0.05%, but remains below its historical average of about 0.10%. The rebound has not yet developed into a forceful breakout. The overall signal leans bearish, in line with selling pressure and the price's position below its average. Still, rising prices are real counterevidence; weak buying does not mean an immediate decline is certain.
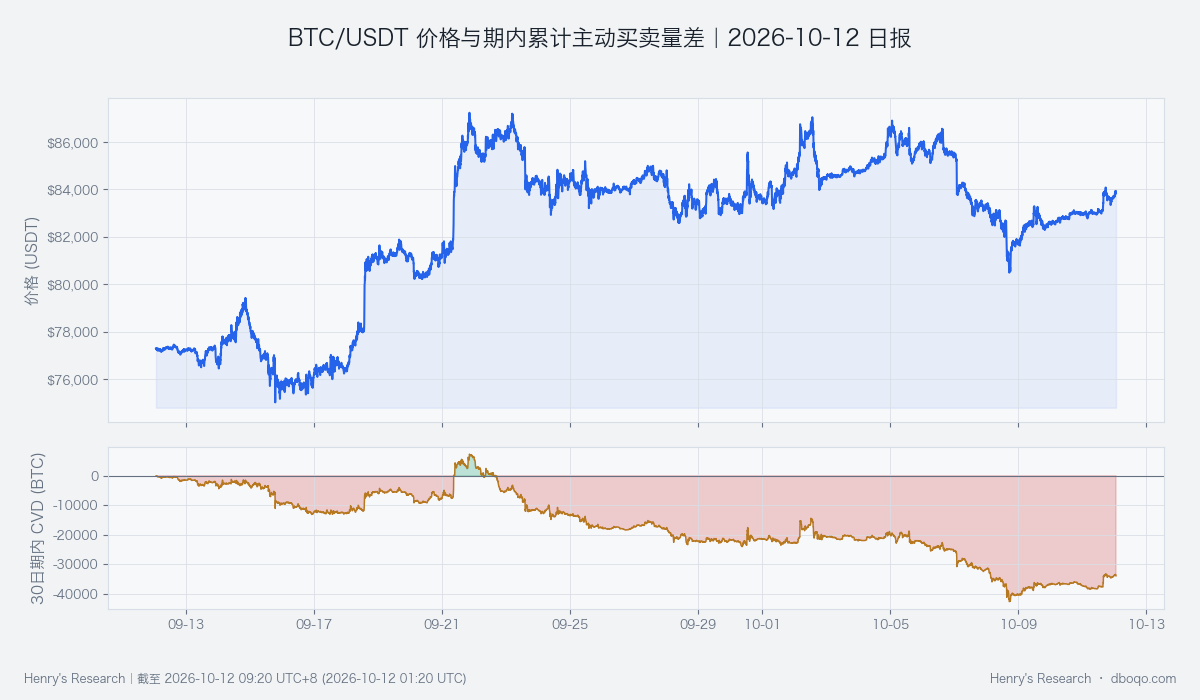
The trend in active buying minus active selling remains weak as price recovers.
Weak fund flows keep attention on the average and buying
ETF flows over the past 5 days show a net outflow of USD 6.66 hundred million. They cannot explain today's price move on their own, but they show that the rebound lacks a firm funding backdrop. If price holds above 84,113.63 USDT while active buying strengthens and volume moves closer to normal, the bearish view should be reassessed. If BTC instead moves back toward its 24-hour low of 82,751.10 USDT with stronger active selling, the stalled rebound would be clearer. Until either change is visible, the improvement in price and trading still needs confirmation.
Data note: As of 2026-10-12 09:20 UTC+8, price and volume cover the past 24 hours. Historical comparisons use 180 periods with matching cutoff times; ETF flows cover 5 days.
Disclaimer: This report by dboqo uses market data as of 2026-10-12 09:20 UTC+8. Cryptocurrency markets are highly volatile. This report is an objective analysis of market conditions and does not constitute investment advice. Investors should assess risks independently and act with care.