Yesterday, BTC edged higher and briefly held its low. Today, trading picked up, yet the price fell another 3.79% and touched 70,635.20 USDT. The tentative stabilization in the previous report has faded, leaving a bearish view for the next 24 hours. A recovery in short-term active buying is a reason not to extrapolate the fall.
A lower low despite heavier trading
Yesterday's intraday low was 73,184.30 USDT; this period reached 70,635.20 USDT and closed at 70,929.20 USDT. Earlier buying support therefore failed to hold. Trading volume over the past 24 hours was 163,750 BTC, above the historical mean of 146,931 BTC across 180 comparable periods at the same cutoff, and above yesterday's 127,241 BTC. More participation tends to give a price move greater weight. Here it accompanied a sharp decline, making yesterday's small gain a weaker case for a rebound.
The decline also stands well apart from the historical mean of negative 0.02%: only about 5 of the 180 comparable periods fell as much or more. That makes this move unusual in the recent sample; it does not mean another decline is certain. Price remains below its recent 10-day average of 75,492.11 USDT. To move out of this weak area, BTC needs to hold a recovery as trading resumes, rather than merely bounce for part of a session.
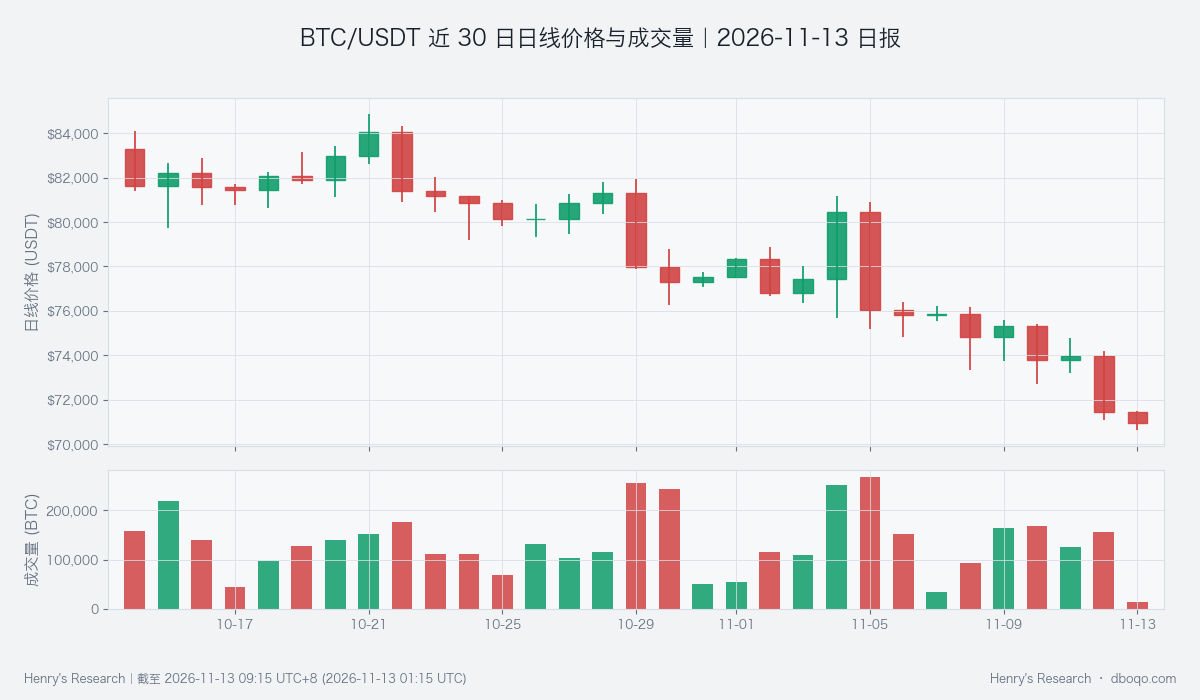
BTC price and volume over the last 30 days: price slid further as trading increased.
Contracting stablecoin supply limits support for a rebound
Stablecoin supply growth over 30 days has fallen to negative 4.43%, against a historical mean of negative 0.92%. Only about 1 of 180 comparable periods was as low or lower. Supply over the past 7 days also contracted by 1.30%, pointing to a tighter pool of funds available for trading. This does not explain every leg of today's decline, but it weakens the case for sustained funding behind a rebound. The dollar is also unusually strong relative to its own history, adding pressure from the wider market environment.
ETF funds saw a net outflow of 10.08 hundred million dollars over the past five days, narrower than the 12.15 hundred million dollars cited yesterday. That is a counterpoint: the fund-flow pressure has not widened in step with the price fall. Still, a five-day total cannot explain this 24-hour decline on its own. The smaller outflow does not yet outweigh the heavier trading and fresh low.
Active buying has improved; the new low is the next test
Active buying minus active selling is now positive 128 BTC, above its historical mean of positive 9 BTC, showing that buyers stepped in after the drop. The overall signal remains bearish, in line with the price and funding backdrop. If BTC holds 70,635.20 USDT and moves back above the previous report's 73,724.50 USDT with improving volume and active buying, this bearish view should be reassessed. If buying fades quickly and price breaks below this period's low again, today's counterpoint will have done little to change the outlook.
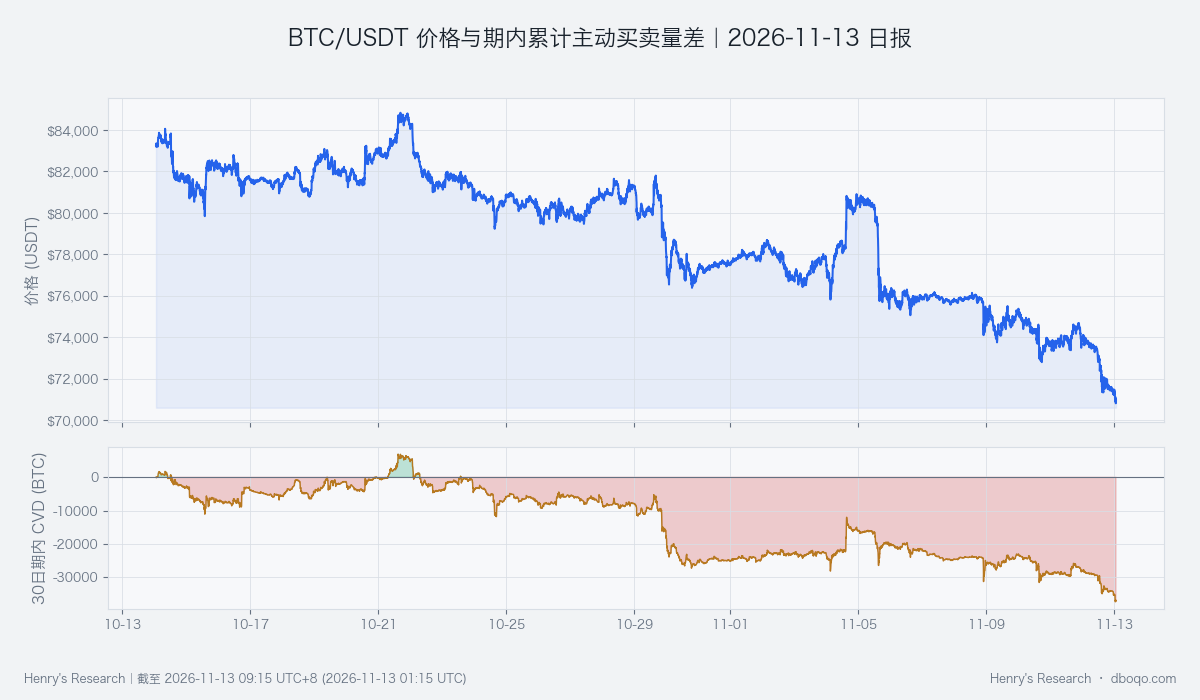
BTC price and active buying minus selling over the last 30 days: buying has improved, while price still needs to stabilize.
Data note: Data is current through 2026-11-13 09:15 UTC+8. The current window covers nearly 24 hours; historical comparisons use 180 periods with matching cutoff times.
Disclaimer: This report was prepared by dboqo using market data through 2026-11-13 09:15 UTC+8. Cryptocurrency markets are highly volatile. This report is an objective analysis of market conditions and does not constitute investment advice. Investors should assess risks independently and make decisions with care.