Yesterday's report focused on narrowing losses. Today BTC fell sharply on heavier trading and touched 57,700.10 USDT. It lost 5.34% over the past 24 hours and stood at 59,138.50 USDT. Near-term buying improved, but that does not yet prove the decline is over. The outlook for the next 24 hours is range-bound. The question is whether the low holds and buyers keep supporting a rebound.
Heavier trading brought a deeper fall, ending yesterday's respite
Trading volume reached 406,087 BTC over the past 24 hours, well above the historical mean of 151,849 BTC across 180 comparable periods ending at the same time of day. Only about 2 periods had more trading. That activity failed to hold up the price and accompanied a 5.34% decline, showing that selling pressure was substantial. The historical mean decline was only 0.09%; in 180 comparable periods, only about 3 matched or exceeded today's loss. The unusually heavy trading and deep fall say more about this move than a round-number price level alone.
The period's high was 62,499.00 USDT and its low was 57,700.10 USDT; BTC then recovered to 59,138.50 USDT. That bounce matters, but the price remains well below the high and the recent 10-day average of 65,681.15 USDT. Yesterday the issue was whether the fall was easing. Today it is whether BTC can stay above its new low after a heavy-volume selloff.
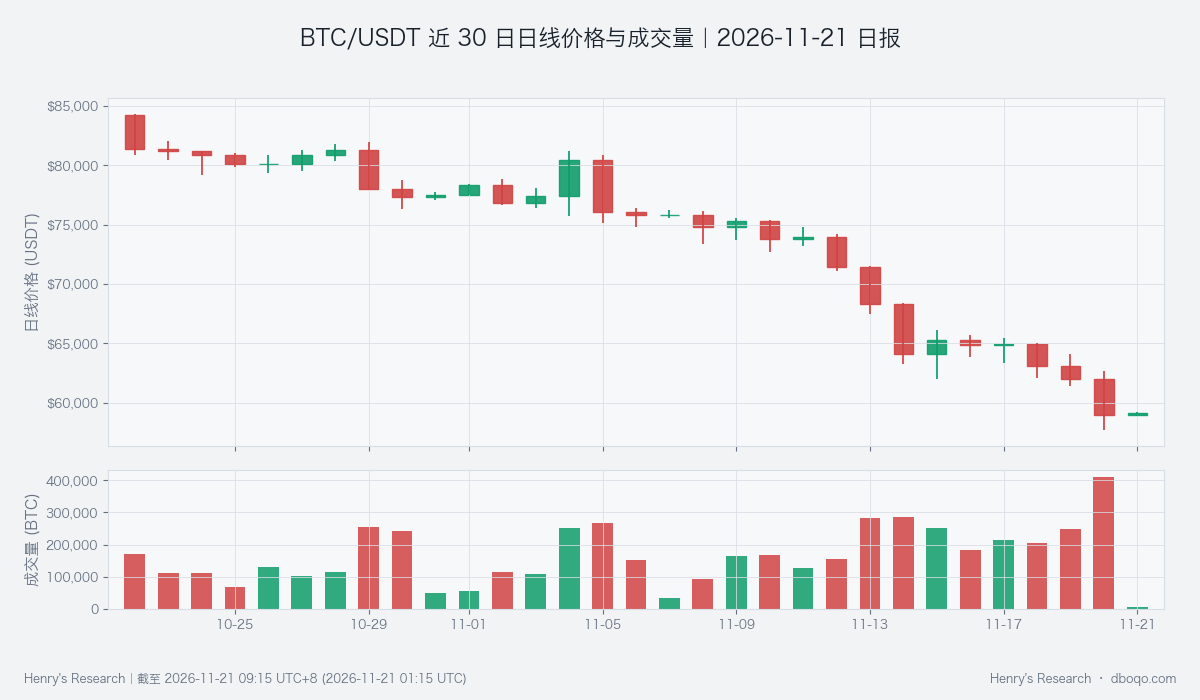
BTC price and volume over the past 30 days: trading rose sharply while price fell.
Near-term buying is a counterpoint, but the daily loss remains
The recent difference between active buying and selling was about positive 300 BTC, versus a historical mean of positive 14 BTC. Only about 5 of 180 comparable periods were higher. This buying strengthened further relative to what the previous report described and fits the recovery from the intraday low. It supports a range-bound view for the next 24 hours, but it reflects recent trading and cannot erase the full-day fall or exceptional volume. The broader signal also points to a range. Buyers still need to show they can hold the price above the low.
Broader capital remains tight; watch the low and the rebound
Stablecoin supply changed by negative 4.39% over 30 days. Only about 8 of 180 comparable periods were as low or lower. This slower-moving capital backdrop cannot explain each intraday move, but it limits confidence in a lasting reversal from a brief bounce. ETF flows showed net outflows of 2.32 hundred million US dollars over the past five days, narrower than the outflow described in the previous report. That is a sign of improvement. The two measures cover different periods and need confirmation from price and trading.
If BTC breaks below 57,700.10 USDT again and near-term buying fades, the range-bound view needs reassessment. A sustained move above 62,499.00 USDT backed by continued buying would also change the assessment of this rebound. The perpetual-futures funding chart provides trading context; it cannot set direction in place of price.
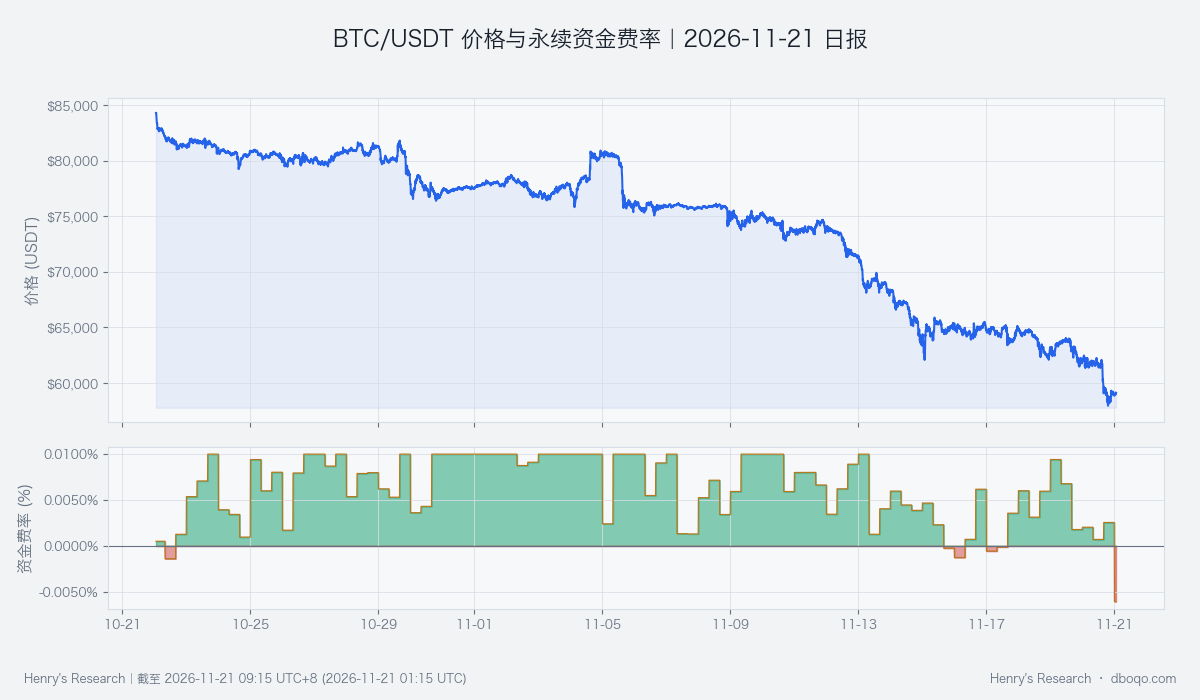
BTC price and perpetual funding over the past 30 days: context for a possible rebound.
Data context: Data are current through 2026-11-21 09:15 UTC+8. Price and volume cover the past 24 hours; historical comparisons use 180 periods ending at the same time of day. Capital measures retain their own observation windows.
Disclaimer: This report was prepared by dboqo using market data available through 2026-11-21 09:15 UTC+8. Crypto markets can be highly volatile. This report is an objective analysis of market conditions and does not constitute investment advice. Investors should assess risks and make decisions independently.