I. Weekly Overview
Data methodology:This report covers the previous complete UTC calendar week from 2026 7 20 00:00 to 7 27 00:00, comprising 2,016 5-minute data points. BTC/USDT opened at 64,694.80 and ultimately closed at 65,375.10, up 1.05% for the week; the intrawEEK high was 66,924.10, the low was 63,666.00, and total trading volume was 819,528 BTC. Put simply, although the week closed higher, the path was not straight upward: it first surged, then gave back gains, and finally recovered.
On 7 20, price first dipped to 63,736.10, then recovered to 65,224.80, with 179,506 BTC traded, making it the most active day of the week; on 7 21, it continued probing 66,924.10 and closed at 66,522.40, while volume fell to 138,895 BTC. Price made a new high, but follow-through capital did not expand in tandem. On 7 22, it closed at 66,082.00, and the advance began to slow.
From 7 23 through 24, price declined for consecutive days, closing at 65,069.60 and 64,116.50, respectively; on 24, it touched a low of 63,666.00, while volume rebounded to 147,537 BTC, indicating relatively clear exchanges between bulls and bears in this area. On 25, volume plunged to 46,248 BTC, with price narrowing around 64,000; on 26, it recovered to 65,375.10. In the final 24 hours, price rose 1.61%, but volume was 65,763 BTC, leaving the recovery weaker than at the start of the week.
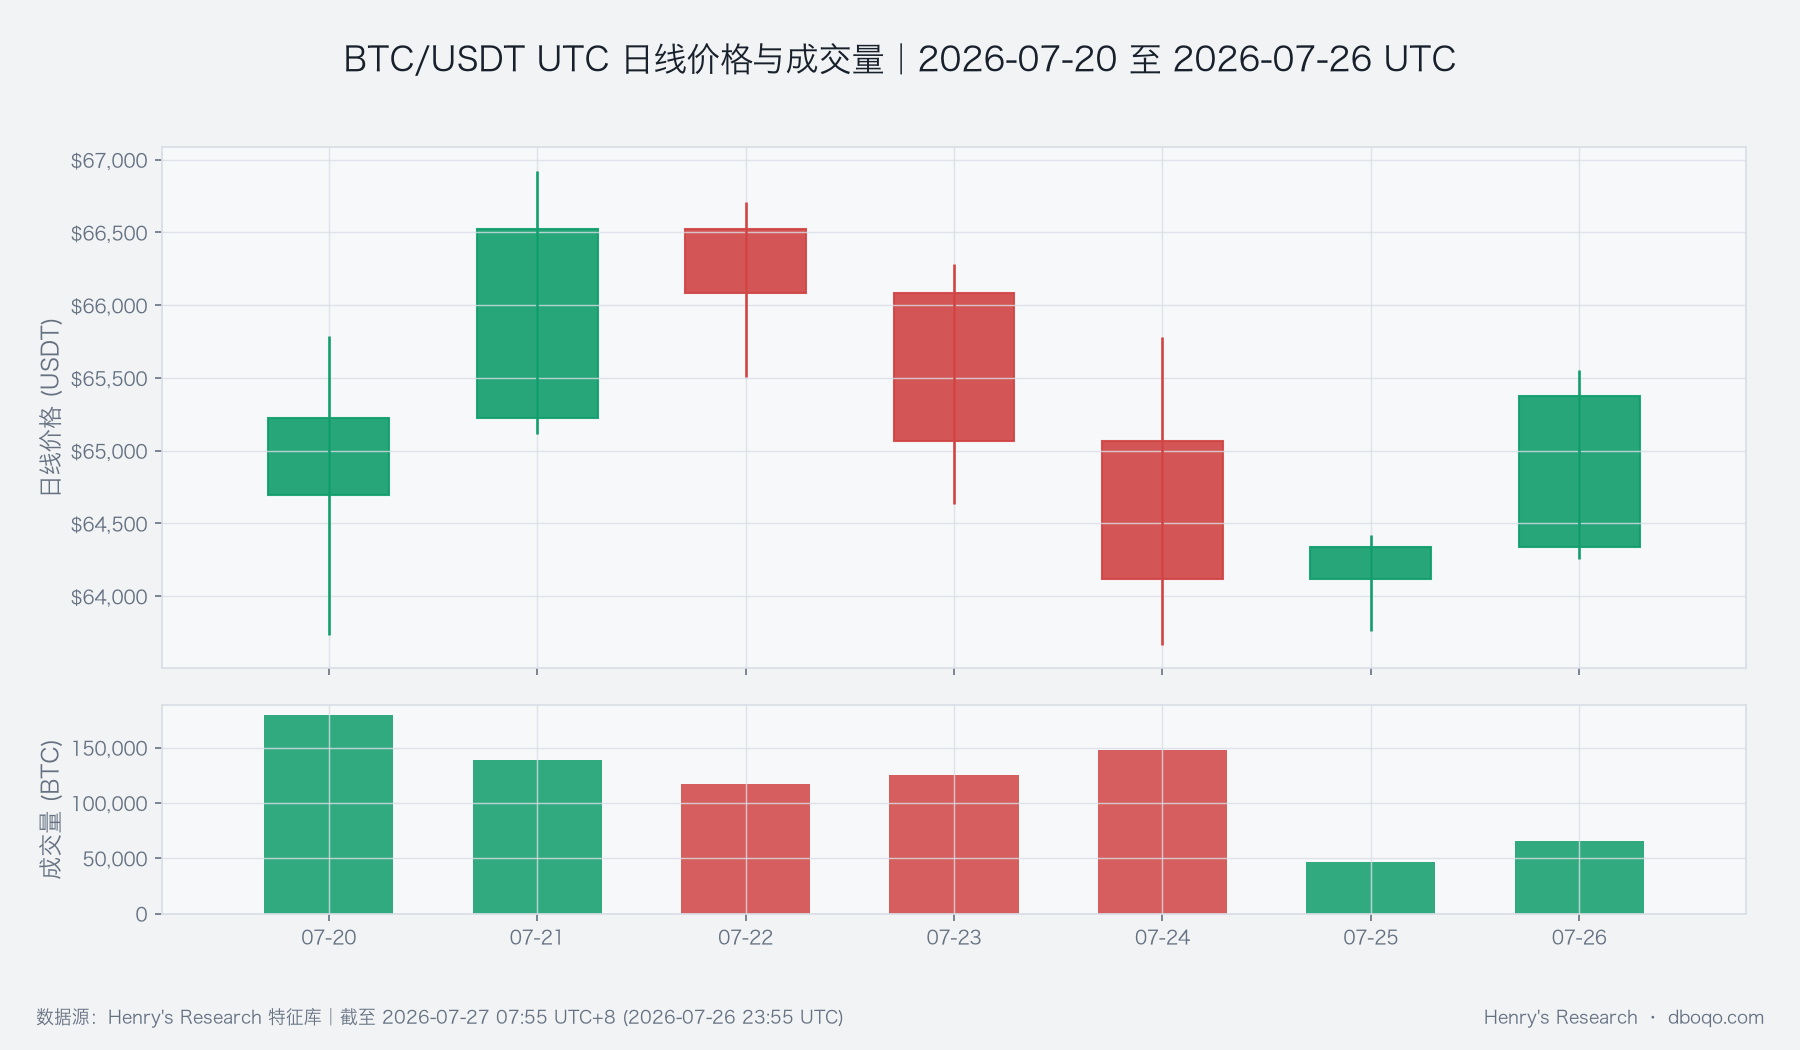 BTC/USDT daily price and volume for the previous complete UTC calendar week
The most noteworthy aspect of the chart is not the weekly gain of 1.05%, but the price-volume rhythm: an early-week surge on higher volume, renewed volume growth during the midweek pullback, and a relatively lower-volume weekend rebound. This means there was genuine demand near 63,666, but also real selling pressure above 66,924. The current picture is more like rebalancing within a range than a completed directional breakout.
II. Technical Deep Dive
The weekend close was above the 10-day moving average of 64,856.57, and also above the 30-day moving average of 63,145.76, leaving the short- and medium-term price structure relatively stable. Daily RSI was 50.49, in a relatively balanced bull-bear zone; the daily MACD histogram was positive at 81.96, indicating that downside momentum has not continued to expand. Meanwhile, the 14-day average true range was 1,540.63 USDT, meaning intraday swings remain wide: being right in direction does not mean the path will be smooth.
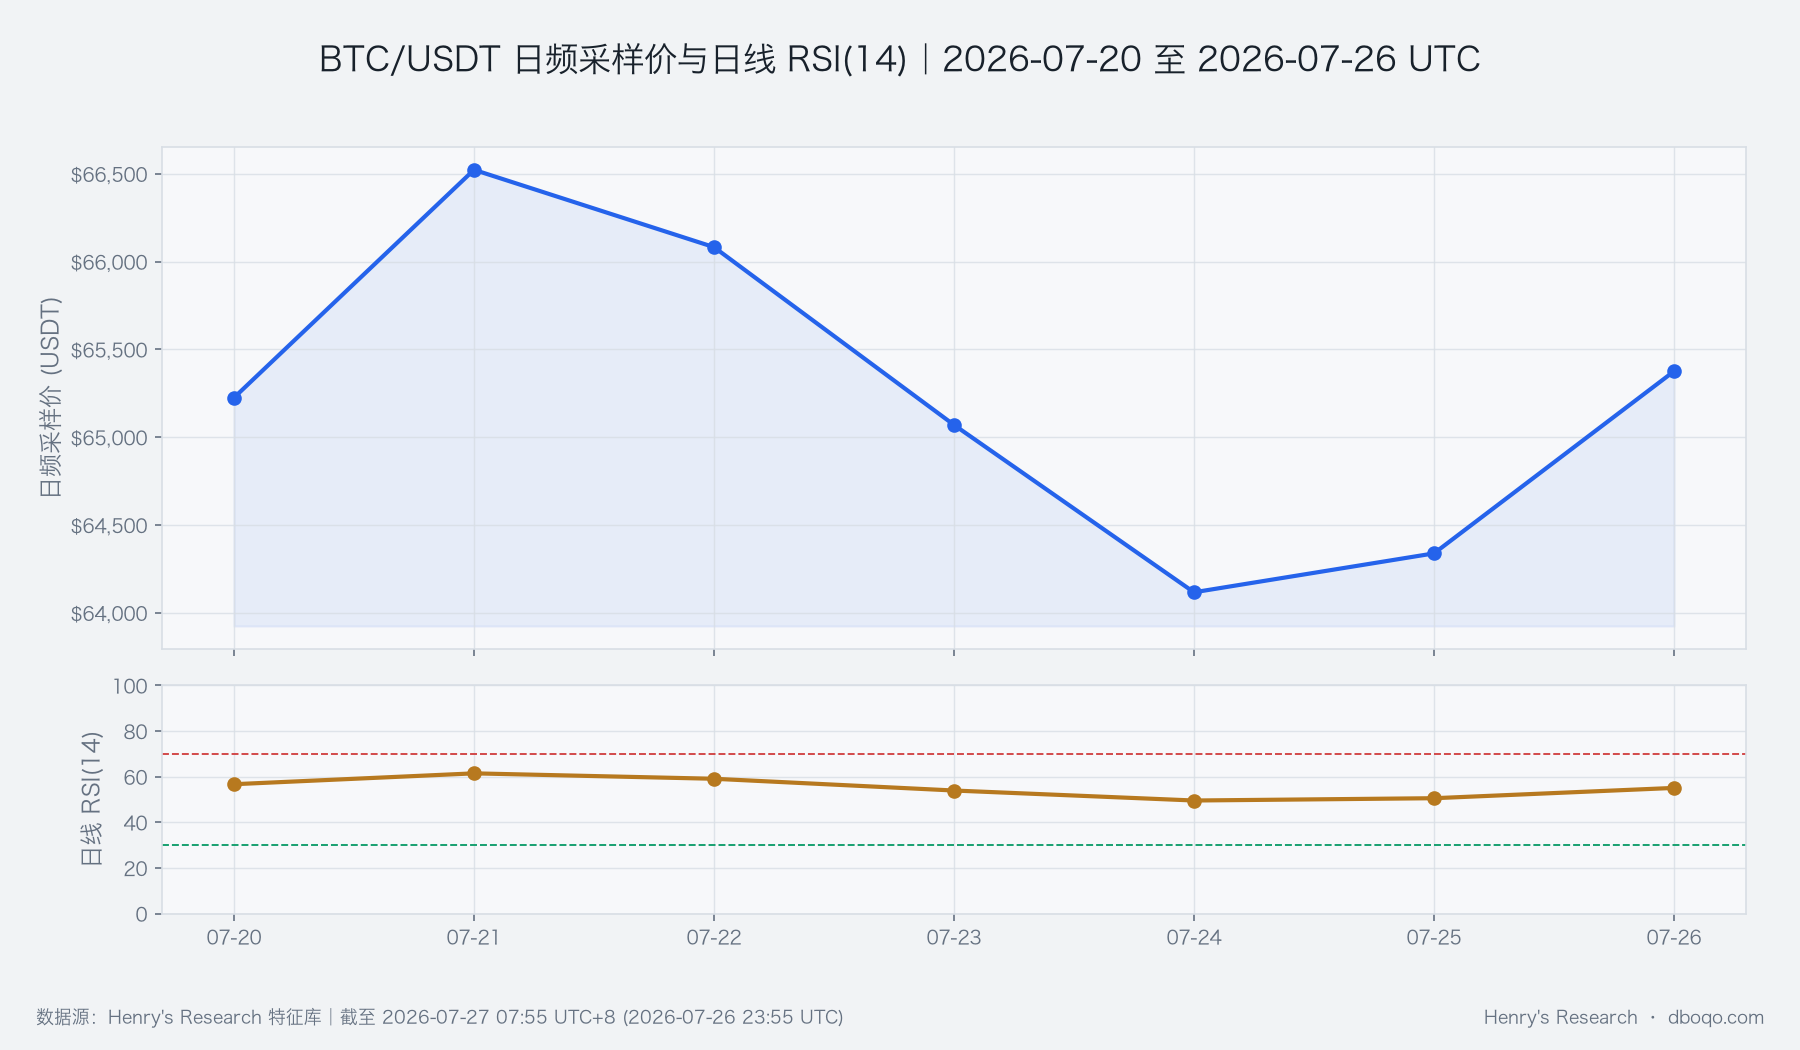 BTC/USDT daily sampled price and daily RSI (14) for the previous complete UTC calendar week
As shown in the chart, after retreating from the midweek high, RSI returned to the neutral zone, without becoming clearly overheated or entering an extreme low. The technical message is therefore “support remains, trend awaits confirmation”: holding near 64,856 favors continued recovery, while a genuine strengthening still requires a move back above 66,924 with a simultaneous recovery in trading volume.
III. Derivatives Market
The latest funding rate is +0.0058%, the long-short ratio is 1.56, and open interest has increased 1.30% from the prior reading, indicating a recovery in both futures participation and bullish bias; however, futures remain at a slight -0.04% discount to spot. Taken together, these figures do not show uniform bullishness, but rather that “some are willing to add risk, while forward pricing remains cautious.” This corroborates the weekend spot rebound that has yet to exceed the week’s high.
Liquidation data are updated daily. The latest day recorded 59.945 BTC, with a cumulative 30-day total of 12,043.670 BTC; it reflects risk that has already been released, and cannot be treated as a real-time directional signal or repeatedly accumulated at 5-minute intervals. This week, there was no evidence that liquidations alone could explain the price path, so the assessment remains based primarily on the joint movement of price, volume, and capital structure.
IV. Capital Flows and Cross-Market Factors
Five-day ETF flows showed net outflows of 4.33 billion USD, while stablecoin supply grew 0.19% over seven days, but still fell 0.74% over 30 days. In plain terms: short-term available liquidity improved slightly, but the medium-term capital base has not fully warmed up. Both ETF and stablecoin indicators update daily and may lag, making them suitable for judging the backdrop, not for explaining the rise or fall of a particular hour.
The U.S. dollar index is 101.45, the volatility index is 18.88, and the 30-day correlation coefficient between BTC and the S&P 500 is -0.0238, close to zero. These three cross-market figures are also daily-frequency, lagging observations. They only indicate that BTC and U.S. equities have not recently had a stable same-direction relationship, and cannot establish a single external cause. Current internal price-volume changes remain more explanatory than cross-market linkage.
V. Review of Key Events
The first key point this week was 7 21: price reached a high of 66,924.10, but trading volume was below the previous day’s level, followed by a gradual pullback over the next two days, indicating a lack of sustained follow-through behind the breakout. The second point was 7 24: price dipped to 63,666.00 and volume expanded again, but the decline did not continue to accelerate; the third point was 7 26: recovering proactive buying pushed price back above 65,000. Together, the three points show “clear overhead supply, demand below, and a weekend recovery still requiring confirmation.”
VI. Overall Assessment and Strategy Signals
The overall assessment is neutral-to-constructive, but with limited confirmation. Evidence supporting a constructive bias includes: a higher weekly close, a close above two daily moving averages, positive daily momentum, and a positive slope in the proactive buy-sell volume difference of 68.72. Factors limiting upside include: the intrawEEK surge and pullback, low volume in the weekend rebound, five-day ETF net outflows, and continuing contraction in 30-day stablecoin supply. The core tension is not “up or down,” but whether the short-term recovery can gain medium-term capital follow-through.
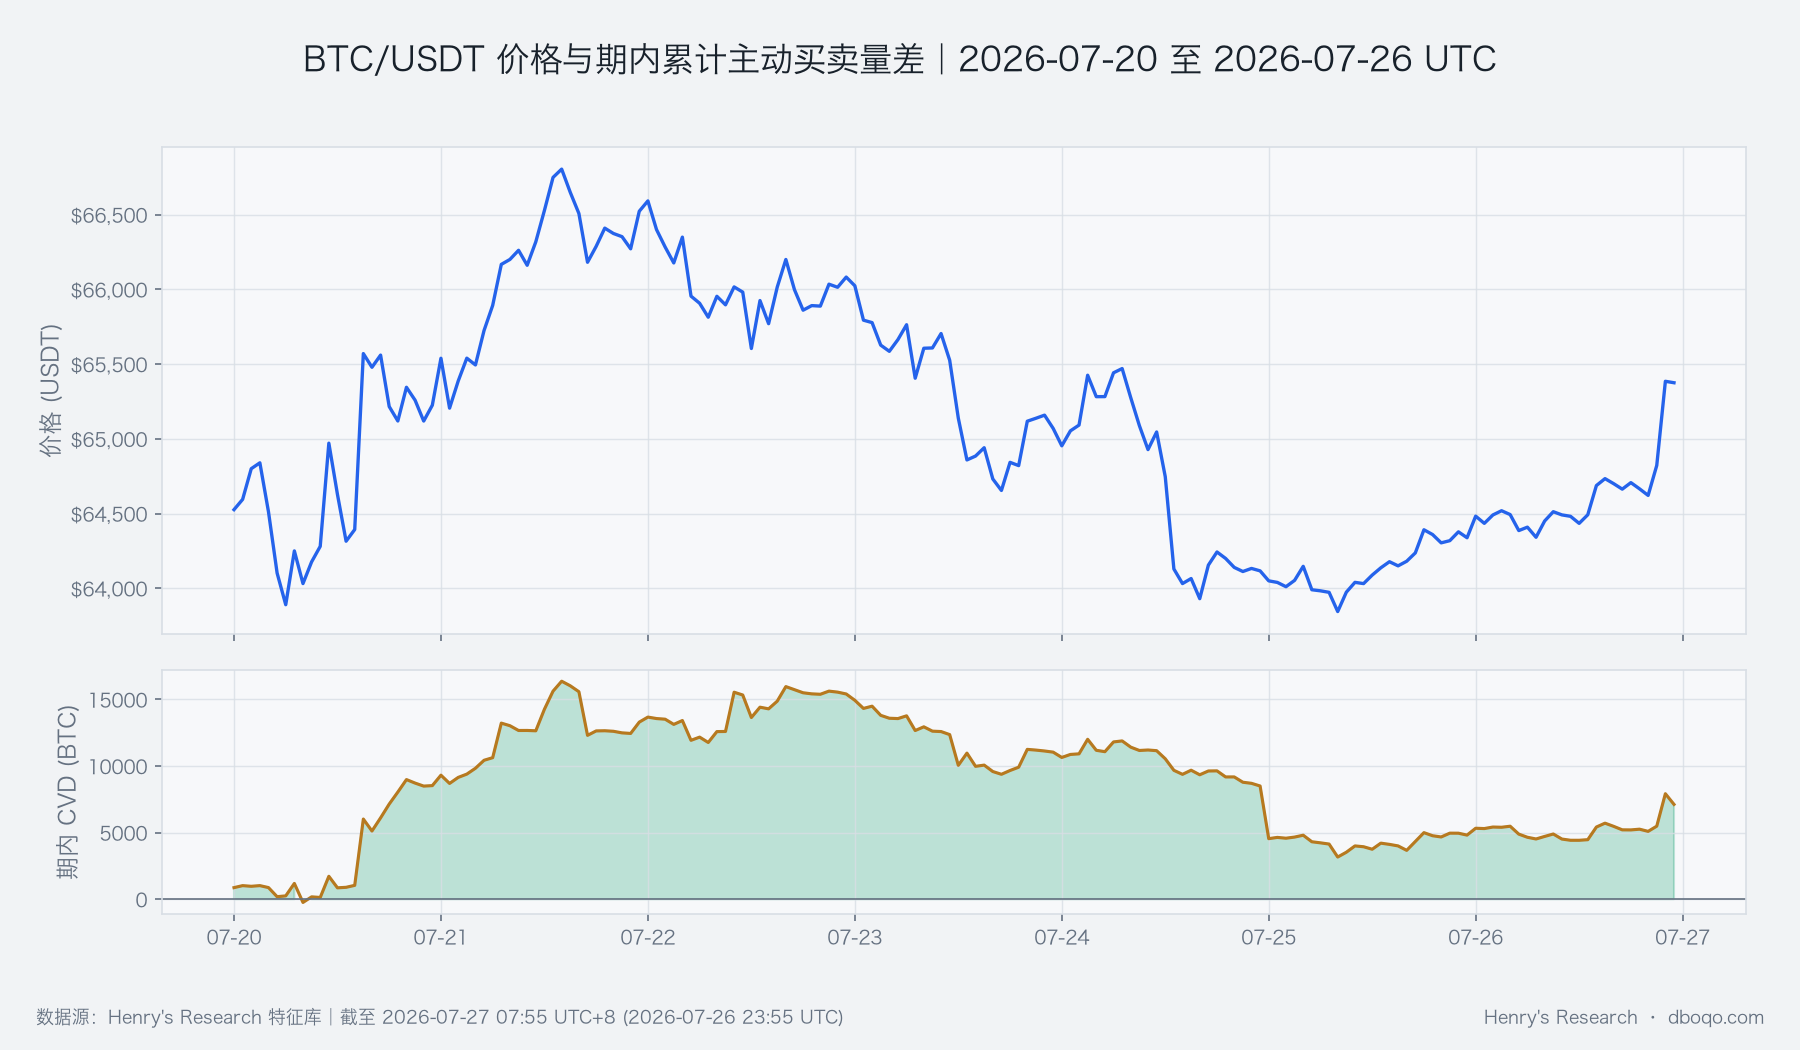 BTC/USDT price and period CVD for the previous complete UTC calendar week
The chart shows that the proactive buy-sell volume difference and weekend price improved together, indicating that the rebound was not entirely unsupported by trading activity; however, this improvement occurred in the latter part of the week and has lasted only a short time. If prices rise later while proactive buying weakens again, this should be understood as deteriorating rebound quality rather than a mechanical continuation of the constructive bias.
VII. Outlook for Next Week
Confirmation conditions:Price first holds near 64,856, then effectively breaks above 66,924, with daily volume and proactive buying strengthening simultaneously; if five-day ETF flows improve and short- and medium-term stablecoin supply both turn positive, confidence in the constructive structure will rise further. The focus then is not a single surge, but whether price can remain above the prior high after the breakout.
Invalidation conditions:Price falls below 63,666 with expanding volume, and then fails to recover even the area near 63,145; at the same time, proactive selling pressure regains the upper hand, ETF outflows continue, and 30-day stablecoin contraction expands. If this combination occurs, it indicates that the weekend recovery was merely a range rebound and downside risk has reopened. If price continues to fluctuate between 63,666 and 66,924, it should continue to be understood as consolidation, awaiting evidence rather than presupposing a direction.
VIII. Risk Notice
This week’s trading range reached 3,258.10 USDT, and the 14-day average true range remains high; a brief move through a key level does not equal an effective breakout. Capital-flow, liquidation, and cross-market indicators may be updated daily or lag, and any individual item may be temporarily distorted. Next week, assess together whether price holds, whether volume follows, and whether the capital backdrop improves; avoid substituting a single number for a complete judgment.
Disclaimer:All data in this report are sourced from dboqo feature database, as of 2026-07-27 07:55 UTC+8. Cryptocurrency markets are highly volatile. This report is solely an objective analysis of market phenomena anddoes not constitute any investment advice, and investors must assess risks independently and make prudent decisions.