Heavy selling in the final days set the week's direction
BTC opened the week at 74,823.40 USDT, rose briefly on Monday, then repeatedly moved lower. It ended Sunday at 65,309.80 USDT, a weekly price decline of 12.71%. Sunday's rebound from the low did not recover the losses of Friday and Saturday. The useful question is when selling accelerated and whether buyers have absorbed it, rather than whether the final session was positive. The outlook for next week is bearish: rising trading activity accompanied falling prices late in the week. A move back into the pre-decline area, supported by stronger buying, would change that judgment.
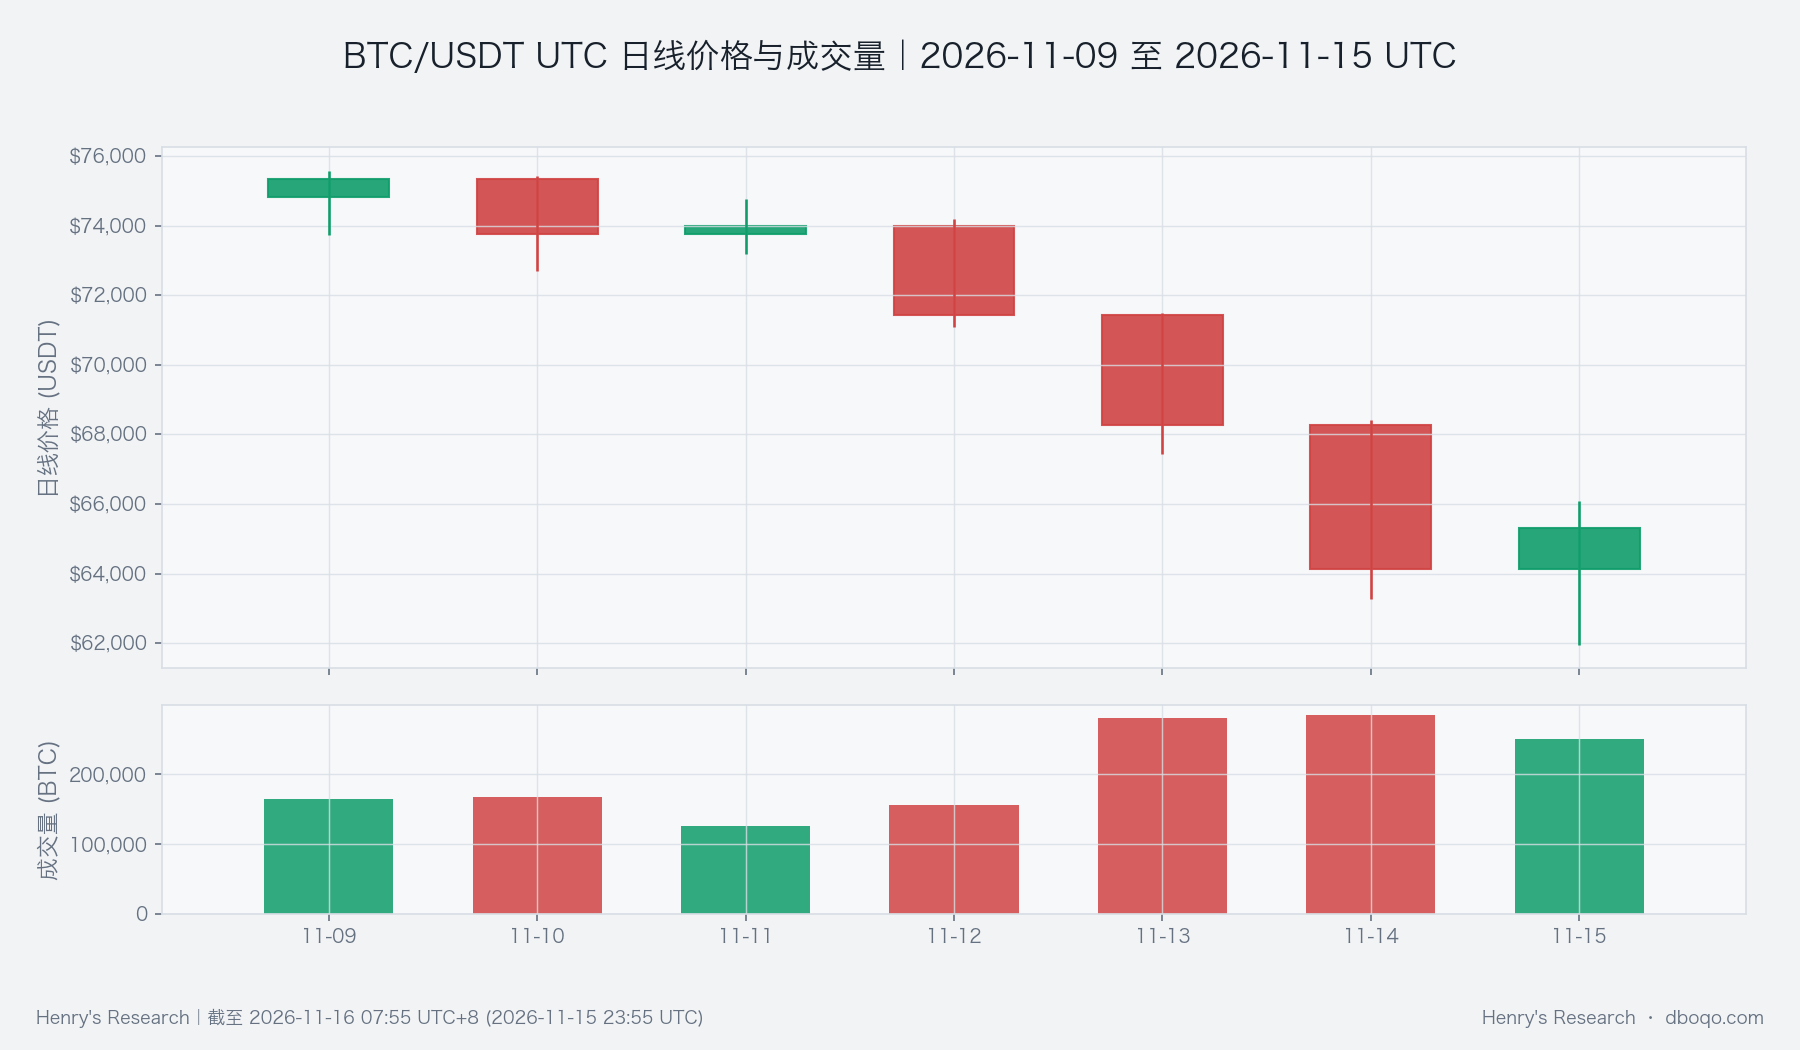
BTC closed Monday at 75,327.00 USDT, fell to 73,762.90 USDT on Tuesday and recovered only slightly to 73,980.00 USDT on Wednesday. After closing Thursday at 71,423.30 USDT, it fell further to 68,279.80 and 64,130.50 USDT on Friday and Saturday. Sunday's low was 61,956.30 USDT before a recovery to 65,309.80 USDT. A modest early decline became a series of new lows. The rebound still left BTC below Thursday's close, which matters more for the coming week than the weekly percentage alone.
More trading did not keep prices from falling
These declines did not happen in an unusually quiet market. Friday and Saturday volume reached 281,461 BTC and 285,302 BTC, well above Monday's 164,395 BTC. Sunday volume was still 251,263 BTC. Weekly volume totaled 1,431,464 BTC, compared with a historical mean of 1,188,187 BTC across 104 comparable weeks. More trading alongside successive price declines points to meaningful selling pressure. Volume alone cannot identify each participant's intent, but a rebound without sustained volume and buying would remain fragile next week.
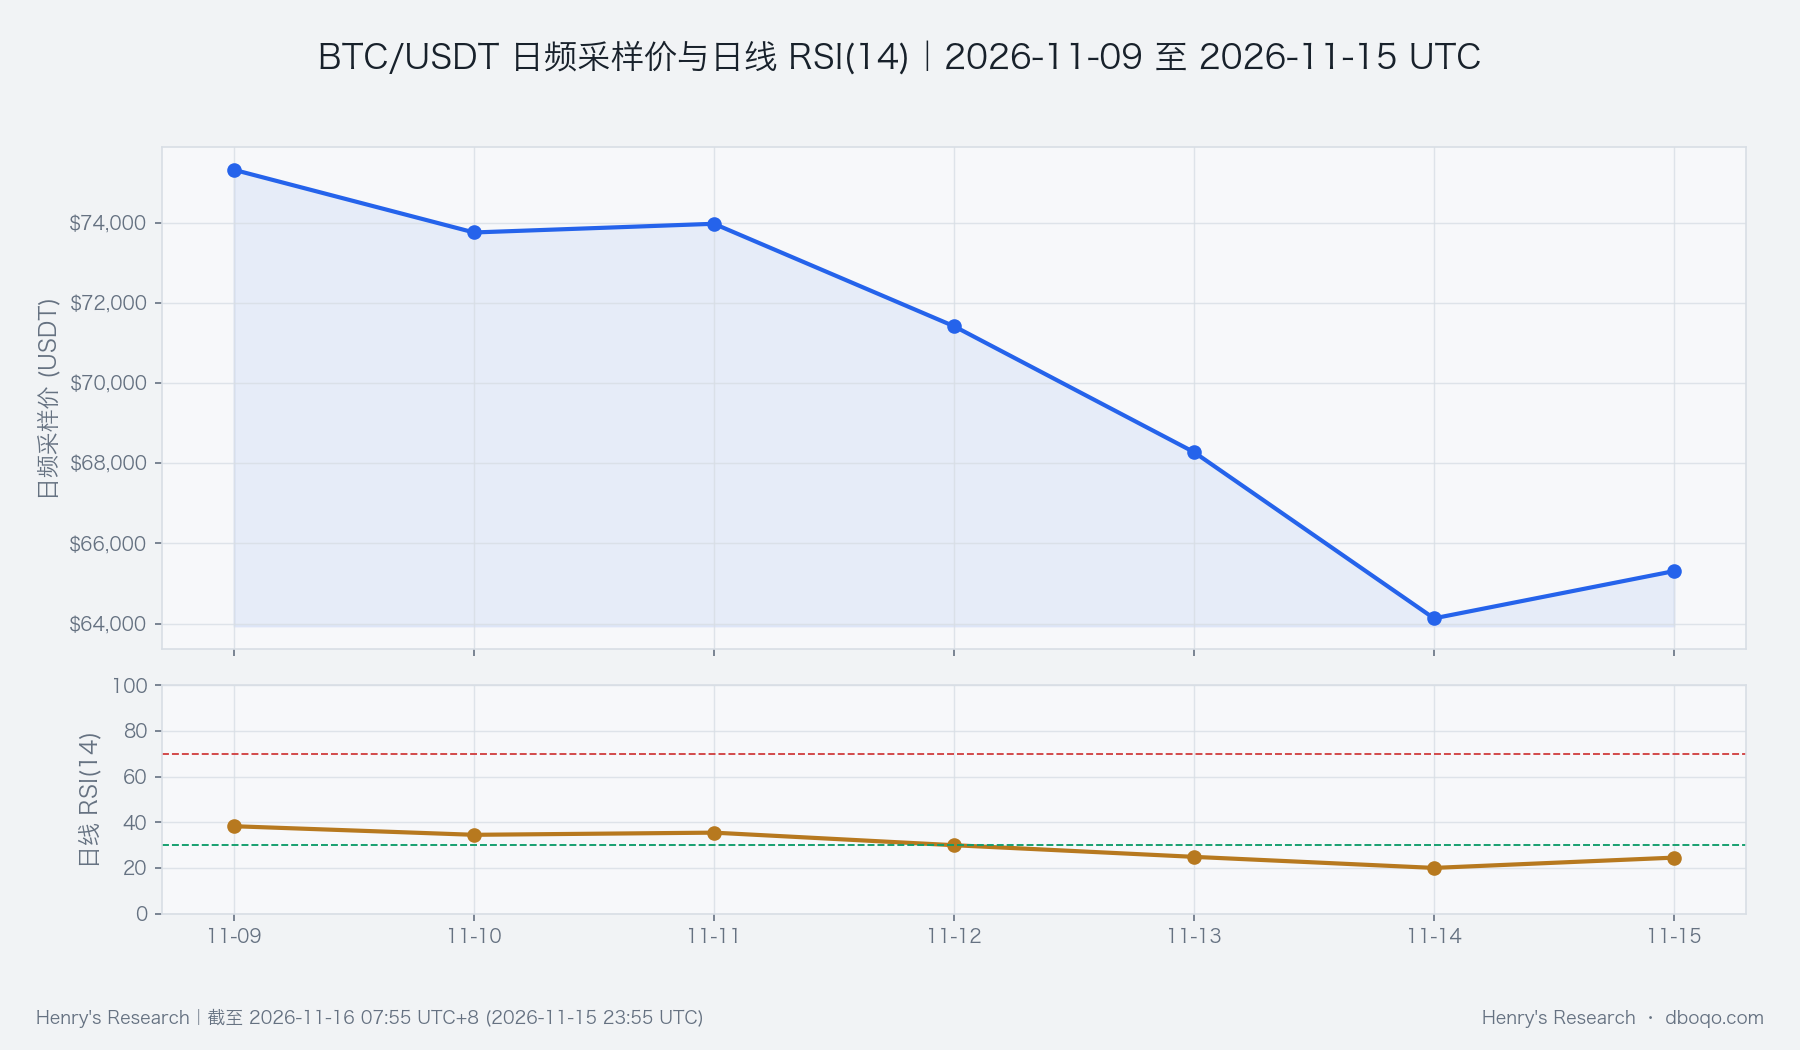
There is a real counterpoint. BTC rose from Sunday's 61,956.30 USDT low to close at 65,309.80 USDT. The latest five-minute strength reading was 56.65, suggesting immediate selling pressure eased. Yet the daily strength reading through Saturday was only 19.64. These measures reflect different time scales; a short rebound does not establish that the broader slide is over. The chart shows the gap between the price bounce and still-weak daily momentum, so the bearish view needs room for revision.
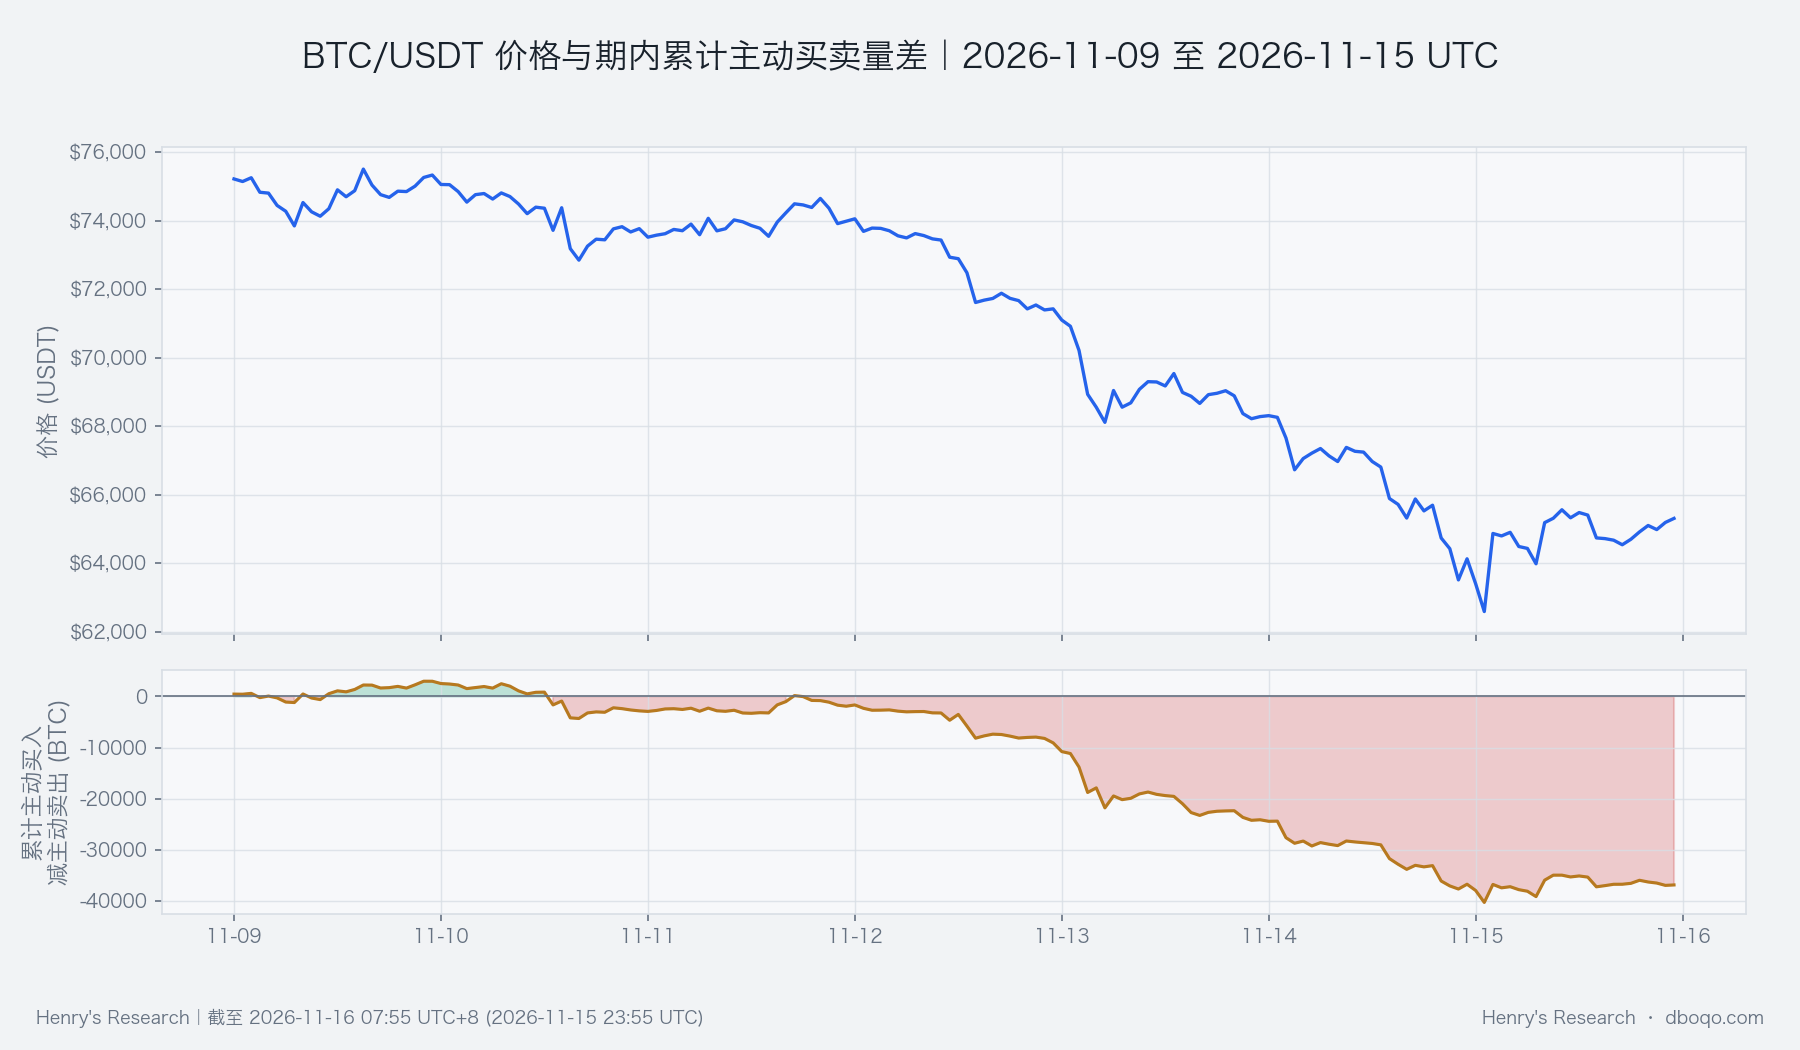
The change in aggressive buying minus aggressive selling, a measure of which side was more eager to trade, ended at negative 13.85 BTC; its historical mean was about positive 1 BTC. This is neither a tally of every trade for the week nor a deterministic cause of further losses. It indicates that a clear buyer advantage had not emerged with Sunday's partial recovery. Together with the high-volume price decline, it argues for caution about calling the bounce a reversal.
Slower capital measures offer little support yet
ETF flows showed a net outflow of 10.5 hundred million US dollars over five days, against a historical mean inflow of 2.61 hundred million US dollars. Stablecoin supply growth over 30 days was negative 4.74%; among 104 comparable weeks, only about 1 was as low or lower. These measures update on different schedules and cover different periods from intraday prices. They cannot explain a particular day's fall or be added into one immediate outflow. Their narrower message is that broader funding conditions have yet to reinforce the late-week rebound. Improving ETF flows and slower contraction in stablecoin supply would weaken this part of the bearish case.
The broader market signal is also bearish, consistent with the week's price, volume and slower capital measures. A historically elevated US dollar measure points to a tighter external backdrop, but it is a slower cross-market clue, not a single proven cause of BTC's decline. The clearest evidence remains BTC's own prices and trading activity, without assigning a tidy causal story to every outside indicator.
Next week, watch whether the rebound can hold
Two observations matter next week. First, can price regain Thursday's 71,423.30 USDT close while volume and aggressive buying recover together? If so, the bearish assessment led by late-week selling would need reassessment. Second, a break below the week's 61,956.30 USDT low on rising volume would undermine Sunday's support. These prices are reference points rather than targets. Slower capital measures should also be read alongside the price and volume actually observed at the time.
Data note:This report covers the complete UTC calendar week, 2026/11/9 00:00 to 11/16 00:00; data end at 11/15 23:55 UTC. Historical comparisons use 104 complete comparable weeks; ETF and stablecoin figures are slower summary measures.
Disclaimer:This report was prepared by dboqo using market data available through 2026-11-16 07:55 UTC+8. Cryptocurrency markets are highly volatile. This report is an objective analysis of market conditions and does not constitute investment advice. Investors should assess risks independently and make prudent decisions.