I. Market Overview
Data basis: As of 2026年7月28日08:55(UTC+8), BTC/USDT was quoted at 63,453.10 USDT, down 2.54% over the past 24 hours, with a trading range of 63,439.10 to 65,722.50 USDT and volume of approximately 150,122 BTC. The price is near the lower end of the range, indicating that the previous day's rebound failed to continue and sellers remained in control ahead of the Asian session. At the same time, the current price is almost exactly at the 30-day moving average of 63,446.55 USDT. Long-cycle support has not yet been decisively broken, so this appears more like a stress test at a key level than a confirmed one-way decline.
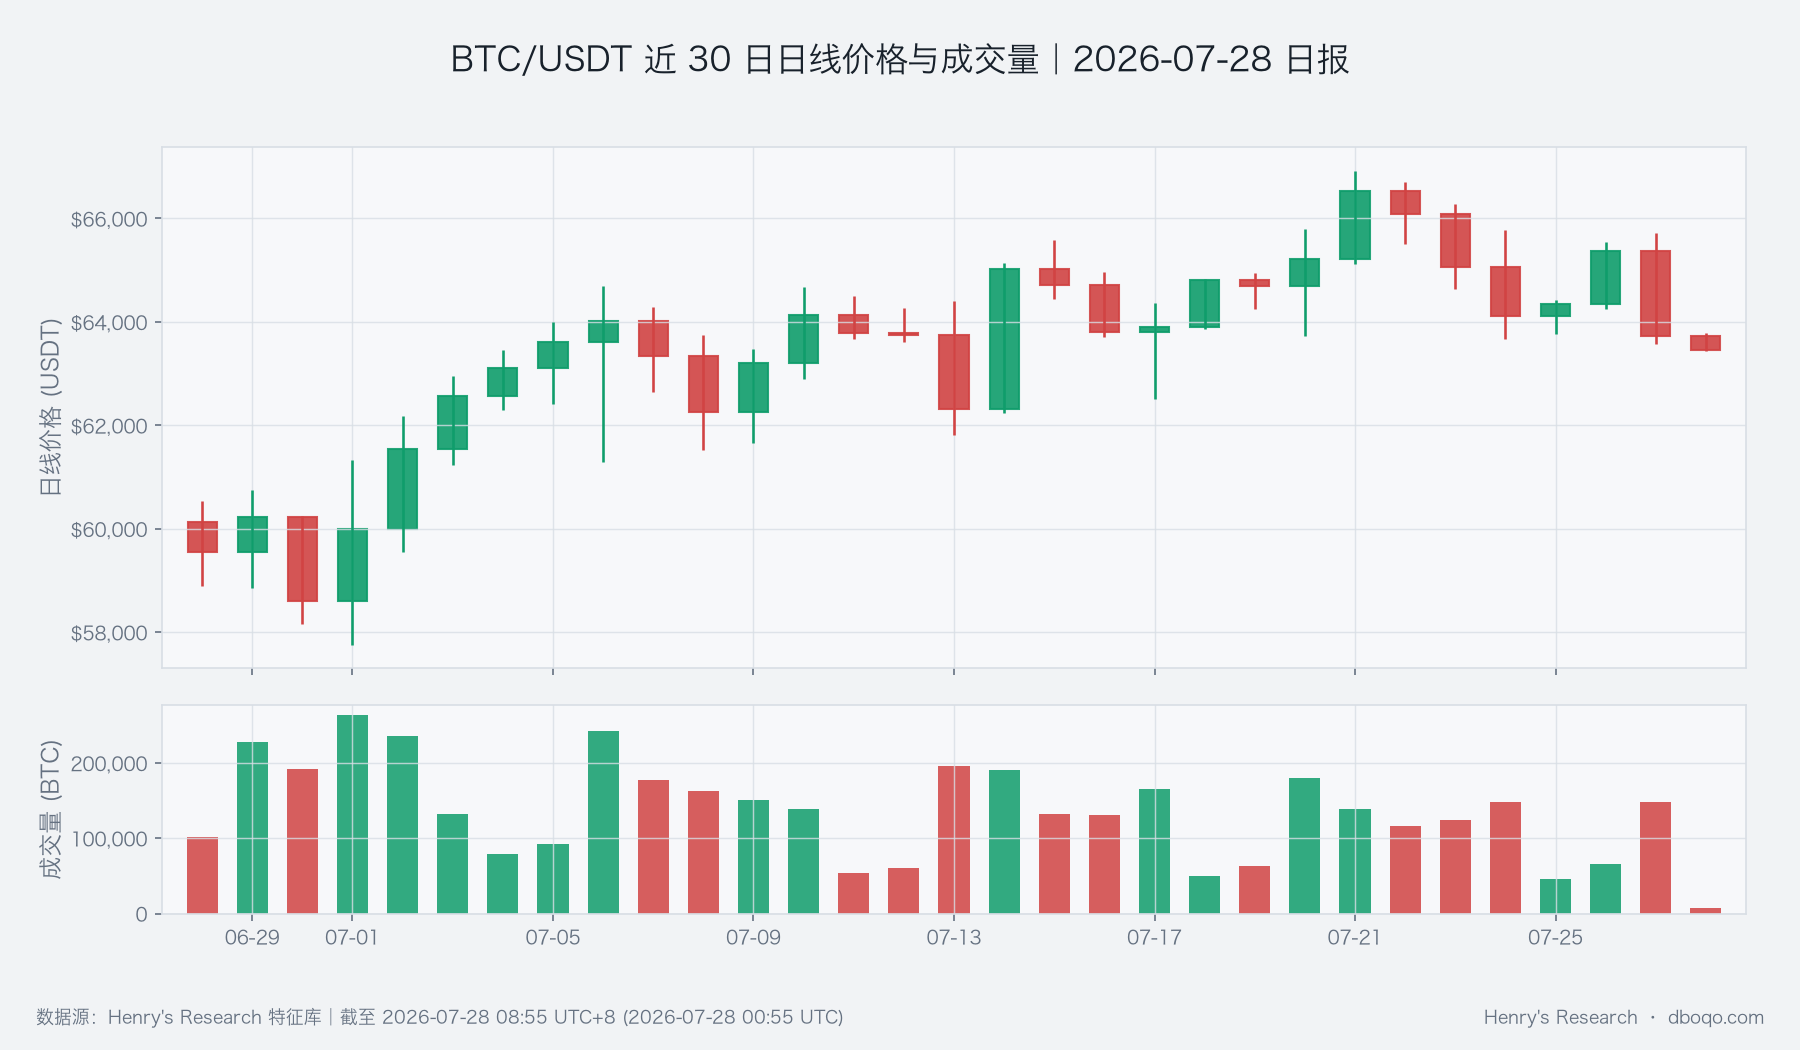 BTC/USDT daily price and volume over the past 30 days
II. Technical Indicators
The daily close is below the 10-day moving average of 64,995.07 USDT, yet remains slightly above the 30-day moving average, creating a direct conflict between the short-term trend and medium-term support. The daily relative-strength reading is 47.67, in neutral territory, while the momentum bar is -20.80 USDT, showing that upward momentum has weakened but has not entered an extreme state. Average daily true range is approximately 1,553.43 USDT, meaning that intraday swings may still be substantial even if the directional view remains unchanged. Readers should treat whether support near 63,400 holds and whether the area near 64,995 can be reclaimed as more important confirmation ranges.
The relative-strength reading on a shorter cycle has fallen to 26.11, reflecting that the market is approaching a cooler area after consecutive declines and may see a technical repair; however, a low reading alone does not equal a reversal. The aggressive-trading slope is -4.20 BTC, and sell trades have continued to exceed buy trades over the past several hours, indicating that the decline is still supported by real trading activity. If price rebounds without a corresponding improvement in aggressive buying, the repair is more likely to be only a pause after the decline.
III. Derivatives and Capital Flows
The perpetual funding rate is +0.0042%, and the long-short ratio is 1.69, indicating that market sentiment still favors longs; meanwhile, basis is -0.15%, and contract size increased 1.18% over the past 24 hours. Falling prices, expanding contract size, and bullish sentiment coexist, showing that newly added risk has not pushed prices higher and instead raises the possibility of amplified short-term volatility. The daily quantity proxy for covered BTC perpetual markets is 810.647 BTC, with a cumulative 11,891.370 BTC over the past 30 days; current volatility has not departed from the recent risk backdrop.
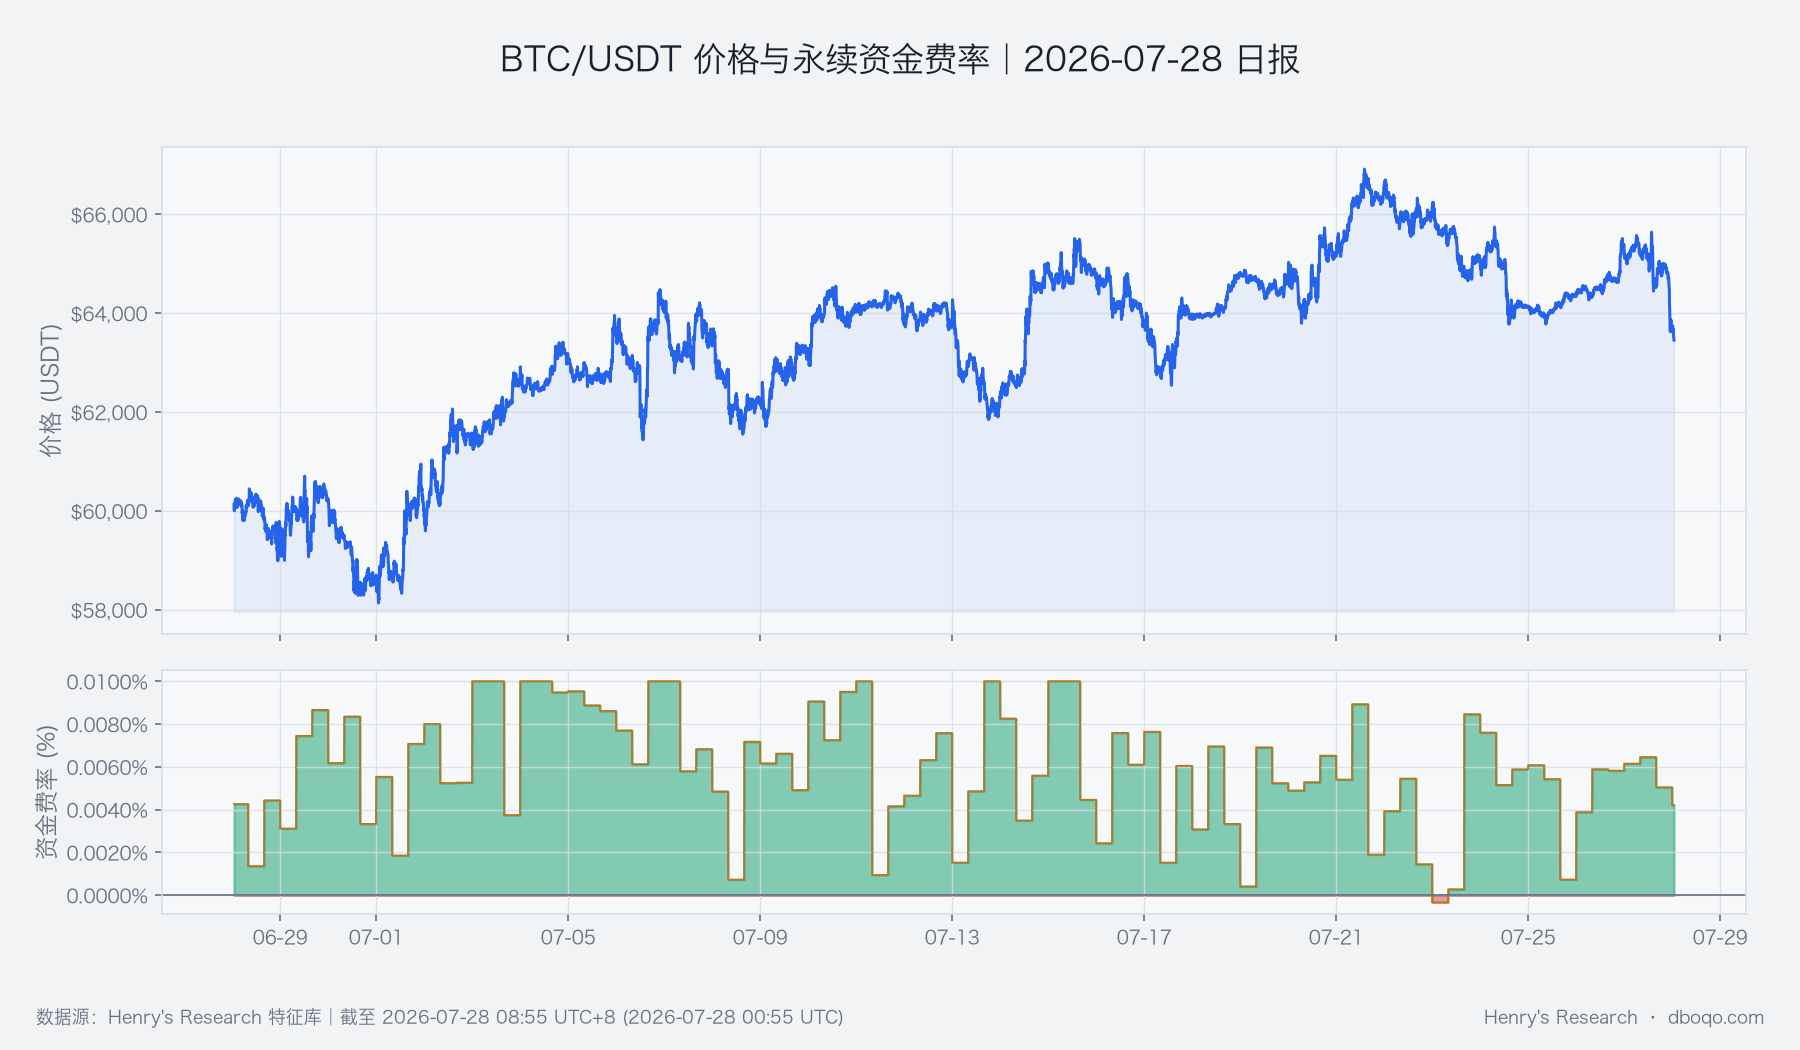 BTC/USDT price and perpetual funding rate over the past 30 days
ETFs recorded net outflows of $9.45 billion over the past 5 days, an important capital-flow signal that runs counter to a short-term oversold repair. It cannot independently explain price changes, but it indicates that incremental off-exchange demand has not yet formed stable support. Stablecoin supply was nearly flat over 7 days and declined 0.55% over 30 days, with medium-term liquidity likewise providing no clear evidence of expansion. If ETF flows remain weak, even a rebound will still require joint confirmation from volume and aggressive buying to establish its persistence.
IV. Cross-Market Environment
The U.S. Dollar Index is 101.21 and the volatility index is 17.72. The macro risk environment has not entered an extremely tense state, but it is also insufficient to offset selling pressure within the crypto market itself. BTC's 30-day correlation coefficient with the S&P 500 is -0.0224, close to zero, indicating weak recent linkage between the two. Therefore, single-day moves in traditional risk assets should not be extrapolated to BTC; the focus should instead be on whether its own price support, capital flows, and trading structure improve in tandem.
V. Overall Assessment
Overall, the short-term price break below the 10-day moving average, dominant aggressive selling pressure, ETF outflows, and medium-term liquidity contraction together form the main downside narrative; cooler short-cycle conditions and support near the 30-day moving average provide an offsetting buffer. The two groups of evidence do not support following a single indicator. The key is whether buying support emerges near 63,400 and whether price can move back above the short-term moving average during a rebound. If support is repeatedly tested without improvement in the trading structure, downside risk will continue to accumulate.
Directional assessment: Bearish. This is a conditional conclusion based on current price, trading, and capital-flow evidence. The dominant signals are weakening short-term structure and aggressive trading, while the opposing risk is that cooler short-cycle conditions may trigger a repair.
Assessment horizon: The next 1–3 days. Conditions for validity: Price remains capped near 64,995 USDT, aggressive selling pressure does not materially recede, and the ETF and stablecoin funding environment does not improve. Invalidation conditions: Price regains and holds above the 10-day moving average, volume expands with the rebound and consecutive aggressive buying emerges, or support near 63,400 receives repeated confirmation.
VI. Risk Notice
The current price is near the long-cycle moving average and the 24-hour low. Cooler short-cycle conditions make both a rapid rebound and a continued decline possible. Funding rates, contract size, and the long-short ratio may change rapidly during sharp volatility, while average daily true range also indicates that expectations of a narrow range are unreliable. When reading this report, price, trading, and capital conditions should be continuously checked to determine whether they remain valid; a single touch of support or a single macro change must not be treated as directional confirmation.
Disclaimer: All data in this report are sourced from the dboqo feature store, as of 2026-07-28 08:55 UTC+8. Cryptocurrency markets are highly volatile. This report is only an objective analysis of market phenomena and does not constitute any investment advice; investors must assess risks independently and make prudent decisions.