I. Market Overview
Data basis: As of 2026年7月29日08:55(UTC+8), BTC/USDT was quoted at 63,927.50 USDT, up 0.75% over the past 24 hours, with a trading range of 62,660.10 to 64,175.00 USDT and volume of approximately 142,135 BTC. The price recovered from the lower end of the range but has not yet effectively moved above the upper bound, indicating that the improvement in buying is more a recovery than an already established one-way breakout.
The price path over the past month has remained characterized by broad back-and-forth movement, with a pullback followed by stabilization in recent days. The current price is slightly above the 30-day moving average but remains capped by the 10-day moving average. Readers should watch whether the area around 64,175 can shift from resistance to support, and whether the area around 63,592 continues to attract buying on pullbacks.
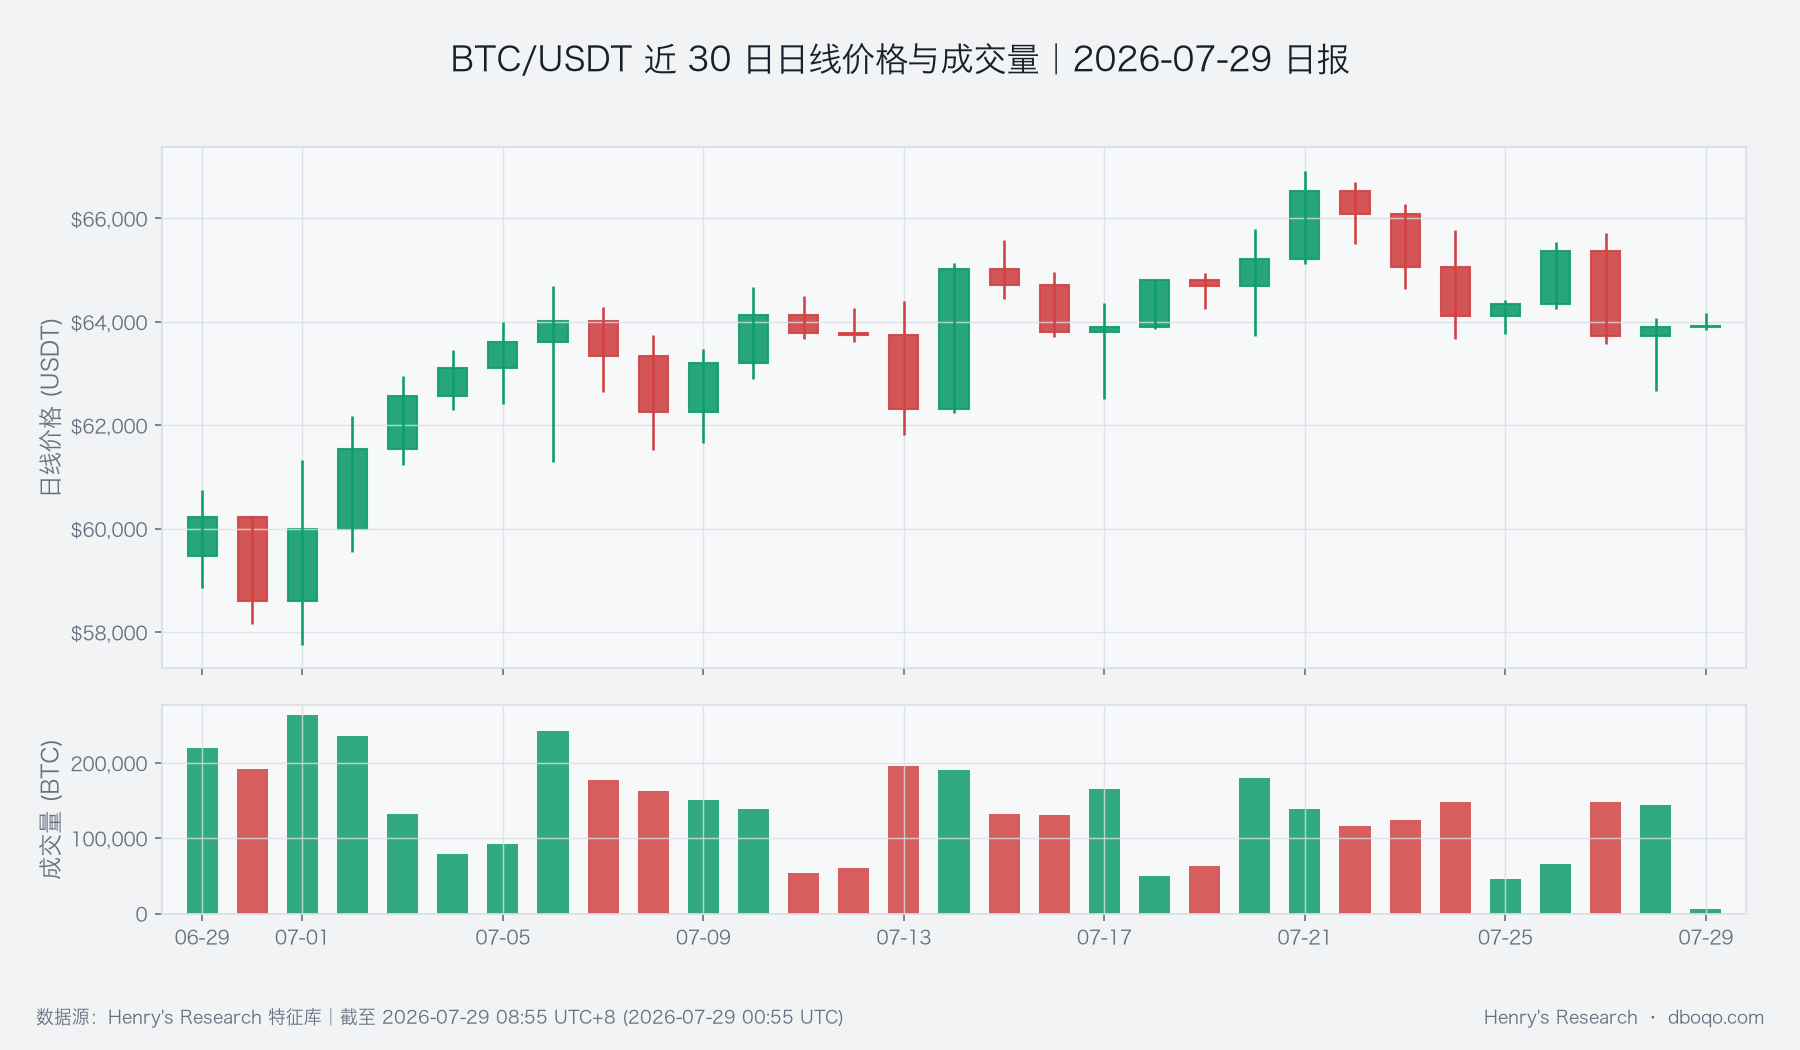 BTC/USDT daily price and volume over the past 30 days
II. Technical Indicators
The daily RSI is 48.62, in a relatively balanced zone between bulls and bears; the intraday RSI is 50.62, also showing no clear overheating or oversold condition. Together, they indicate that the current rebound has not consumed excessive momentum, but it also lacks the strength needed to confirm trend expansion. The quality of subsequent breakouts around key moving averages matters more than any single rise or decline.
The daily MACD histogram is -79.29, indicating that medium- and short-term momentum remains weak; meanwhile, the change slope of active buying and selling pressure is positive, showing that short-term buying has warmed. The two signals point in opposite directions: the former suggests that the earlier adjustment has not been fully absorbed, while the latter explains why the price was able to rebound from the 24-hour low.
The 14-day average true range is approximately 1,448.81 USDT, close to the 24-hour high-low range of 1,514.90 USDT, so current volatility has not contracted abnormally. If the price approaches the edges of the range, short-term swings may still widen and should be assessed together with closing position and volume.
III. Derivatives and Capital Flows
The perpetual funding rate is +0.0100%, and the long-short ratio is 1.71. Market sentiment leans bullish but has not reached extreme crowding. Futures basis is -0.09%, while open-interest change is -2.23%, indicating that incremental risk capital decreased even as the price recovered; this is more consistent with spot absorption after cooling than with concentrated futures-driven chasing.
The daily quantity proxy for the covered BTC perpetual market is 394.870 BTC, with a cumulative total of 11,936.625 BTC over the past 30 days. This metric is used to observe relative changes in pressure release and cannot represent the immediate scale of the entire market; it should be understood together with the price range, volume, and open interest.
ETF net outflows over the past 5 days totaled $7.32 billion, one of the clearest current downside risks; stablecoin supply rose slightly by 0.03% over the past 7 days but still declined by 0.45% over the past 30 days. Short-term liquidity has shown marginal stabilization, while the longer-cycle capital backdrop remains cautious. Therefore, whether the recovery in buying can continue requires simultaneous confirmation from improving off-exchange capital and a price breakout.
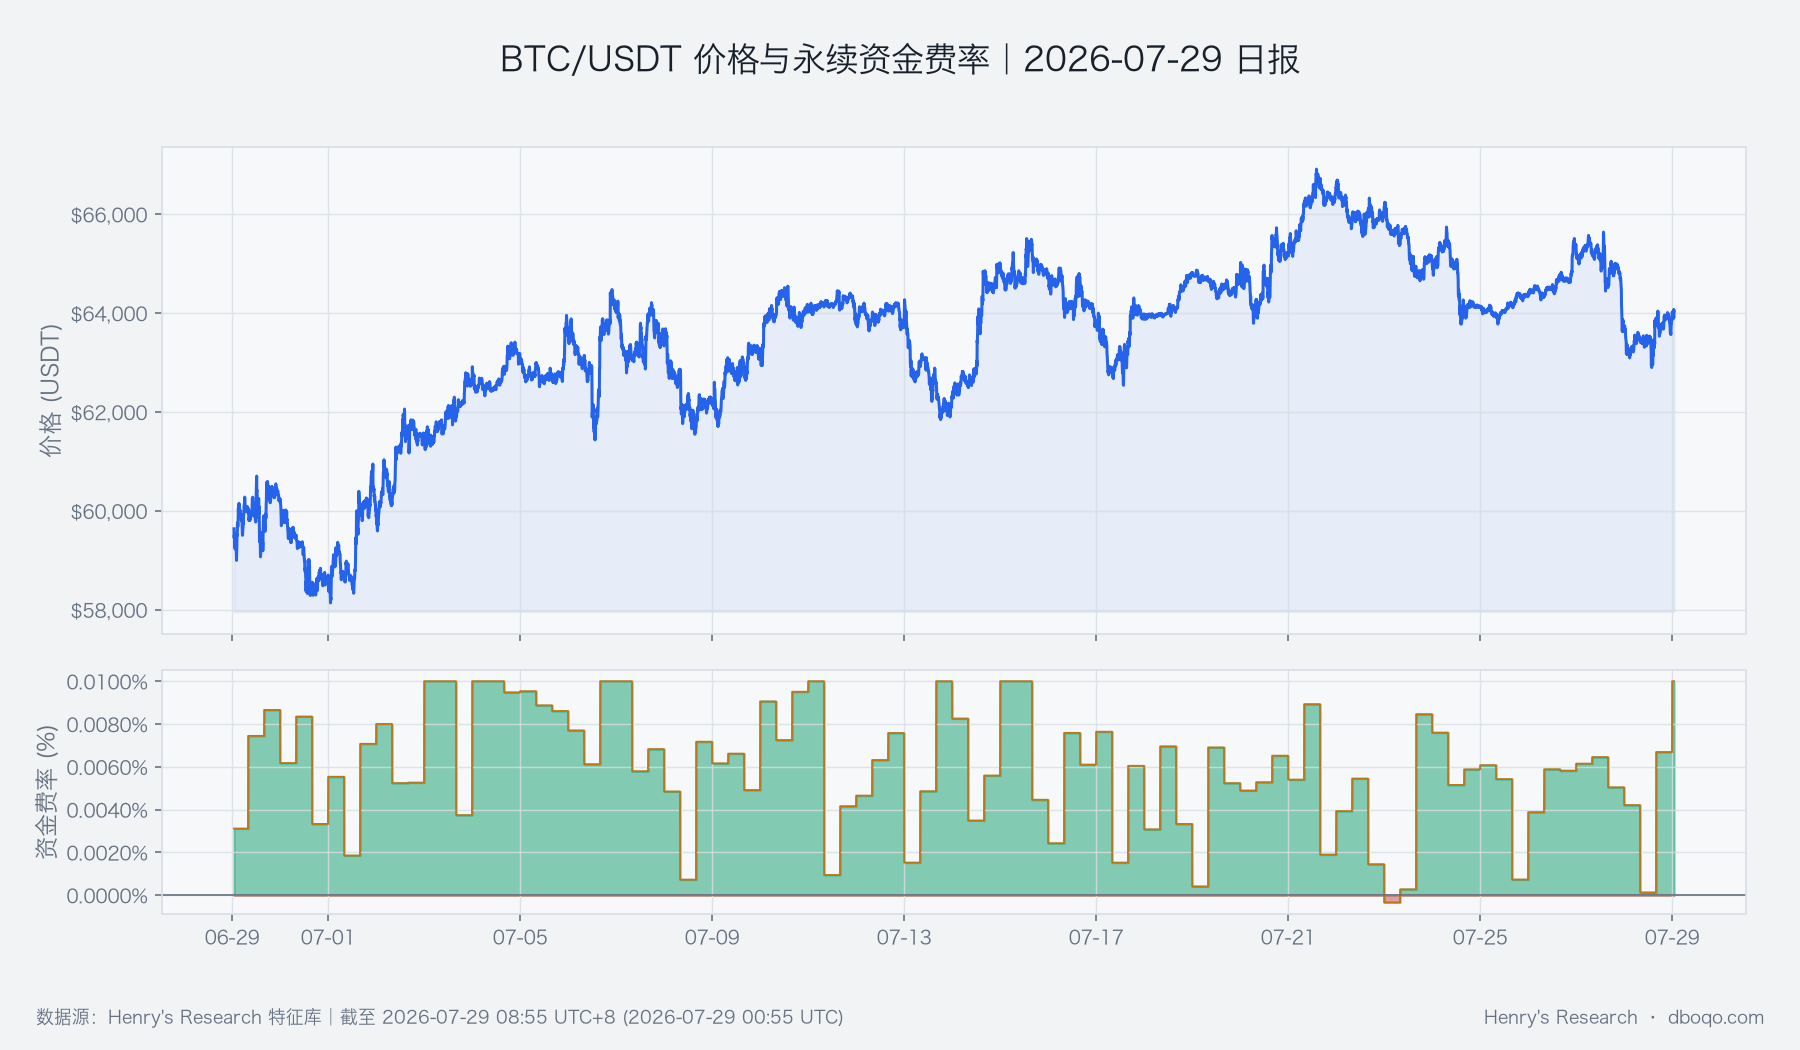 BTC/USDT price and perpetual funding rate over the past 30 days
IV. Cross-Market Environment
The U.S. dollar index is 101.52 and the volatility index is 18.80, indicating that the external environment has not entered an extremely tense state. BTC’s 30-day correlation coefficient with the S&P 500 is -0.0571, close to zero, meaning that recent U.S. equity moves have limited explanatory power for BTC.
During periods of weak correlation, BTC’s own capital flows, derivatives structure, and key price levels carry greater reference value. A stronger dollar or rapid rise in market volatility could still suppress risk appetite; if the external environment remains stable, whether internal buying can absorb ETF outflows will become the main observation point for short-term directional selection.
V. Overall Assessment
The dominant current signals are the price moving back above the 30-day moving average and improved active buying, while opposing risks come from resistance at the 10-day moving average, ETF outflows, and declining open interest. The technical picture provides support below, but capital conditions have not yet formed the combined force required for a breakout. Therefore, the more reasonable interpretation is range recovery rather than trend reversal.
Directional view: Range-bound. This is a conditional conclusion based on the combined conditions of price structure, active buying, futures cooling, and off-exchange capital; short-term recovery holds a slight advantage, but overhead resistance and capital outflows keep directional confidence limited.
Assessment horizon: The next 1–3 days. Conditions for validity: The price holds the 30-day moving average around 63,592, active buying remains positive, and the 64,175 to 64,905 area is tested with volume support. Invalidation conditions: The price breaks below 62,660 on increased volume, or it probes higher but buying weakens while open interest and funding rates heat up rapidly at the same time; the former would shift the assessment bearish, while the latter would raise the risk of a rally followed by a pullback.
VI. Risk Disclosure
This assessment relies on the price and capital structure as of the current cutoff time. Subsequent macro news, liquidity changes, or unexpected events may rapidly alter market conditions. In particular, when intraday volatility remains close to the 14-day average, intraday noise is substantial; continuous closes and mutual confirmation across multiple signal types should be used, avoiding treating any single indicator as a definitive conclusion.
Disclaimer: All data in this report are sourced from the dboqo feature repository, as of 2026-07-29 08:55 UTC+8. Cryptocurrency markets are highly volatile. This report is only an objective analysis of market phenomena and does not constitute any investment advice; investors must assess risks independently and make prudent decisions.