One. Market Overview
Data scope: As of 2026-08-05 08:55 UTC+8, BTC/USDT was at 63,970.90 USDT, up 1.00% over the past 24 hours. It reached a high of 64,512.90 and a low of 63,337.50, with trading volume of 130,208 BTC. In plain terms, price rebounded from the lower part of the range but pulled back after approaching the intraday high. Buyers are providing support, yet the market has not formed a one-way sequence of rising levels. For general readers, sentiment has improved from the previous day, but any breakout still needs confirmation from subsequent price action and volume.
The 30-day chart shows price returning toward the 64,000 area after an earlier decline. The current move looks more like a recovery within a range than a clean escape from overhead pressure. The intraday range was about 1,175.40 USDT, below the 14-day average true range of 1,532.45 USDT; average true range simply describes how far price typically moves in a day. Volatility has not expanded noticeably, so the rebound is not disorderly, but it is not strong enough on its own to prove that a new trend has begun.
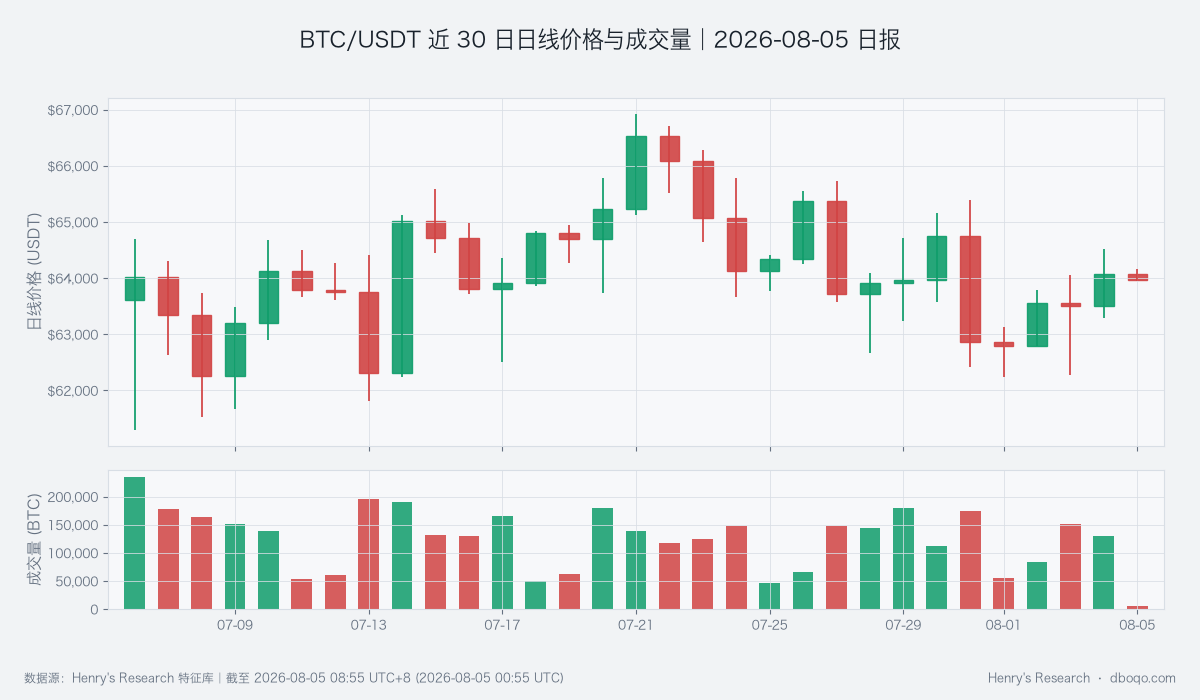
BTC/USDT daily price and volume over the past 30 days
Two. Technical Indicators
Price is now above the 10-day average of 63,848.33 but below the 30-day average of 64,118.86. A moving average is the average price over a past period and helps show the market's center of gravity. Moving above the shorter average indicates that recent pressure has eased, while remaining below the longer average means overhead resistance has not cleared. The two averages are only 270.53 USDT apart and price sits between them, making a sustained hold near 64,118.86 more important than a brief move above it.
The daily relative strength index is 50.46, a neutral area where neither side has a clear advantage; its intraday reading is 36.69, showing weaker short-term momentum after the morning pullback. The daily momentum histogram is -131.82 USDT and remains below zero, which means the influence of the earlier decline has not fully faded. Put simply, the medium-term temperature has returned to neutral while the short term is still cooling. This matches the retreat from the high and explains why the rebound cannot yet be treated as a confirmed breakout.
Three. Derivatives and Fund Flows
The funding rate is +0.0017%. Funding is a periodic payment exchanged between the two sides of the perpetual market, and a positive value means the long side is paying slightly; the current rate is very low and does not show obvious crowding. The long-short ratio is 1.29, indicating a moderate tilt toward longs without overheating. Meanwhile, open interest declined 0.24% over the past 24 hours, and perpetual contracts traded at a 0.07% discount to spot. Together, this looks more like participants reducing risk during the rebound than a wave of new money chasing the move. That lowers overheating risk but also removes fuel for a continued rise.
The slope of active buy-sell volume is -106.91 BTC. Active trading refers to buyers or sellers willing to cross the current price and complete a trade immediately, so the negative reading indicates that sellers remain slightly more aggressive. Price has improved while the active buy-sell balance has not strengthened with it, creating the key divergence to watch: the surface price action is better, but the force behind transactions has not fully followed. The daily quantity proxy for the covered BTC perpetual markets is 206.273 BTC, with a 30-day total of 10,655.343 BTC. These figures help track changes in pressure and do not represent real-time events across the entire market.
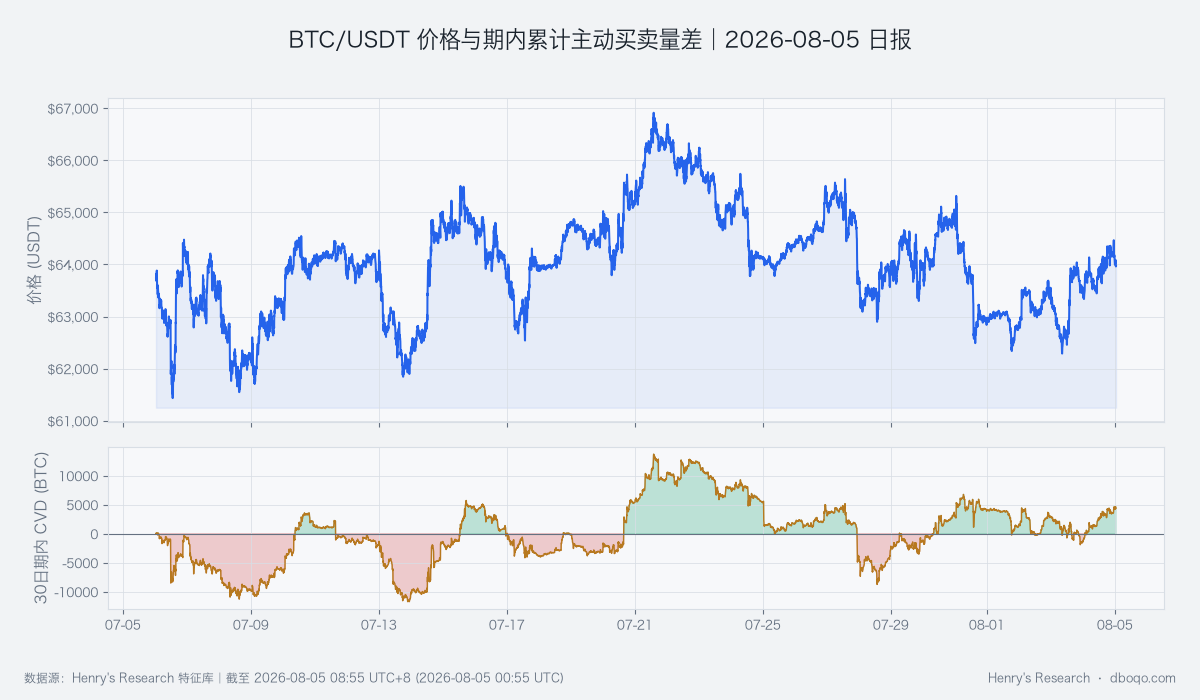
BTC/USDT price and cumulative active buy-sell volume difference over the past 30 days
Four. Cross-Market Environment
Fund flows remain the main counterweight to the rebound. ETFs recorded net outflows of about 5.85 hundred million US dollars over the past 5 days, indicating that traditional access channels have not provided sustained incremental demand. Stablecoin supply fell 0.85% over the past 7 days and 0.67% over the past 30 days. Stablecoins are often viewed as purchasing power that can be deployed quickly in crypto markets. A contraction does not guarantee that price will fall, but it may mean less capital is available to extend a breakout. Weakness in both ETF flows and stablecoin supply makes this rebound more dependent on rotation within existing capital.
The dollar index is 100.02 and the volatility index is 16.05, so external markets are not giving an extreme risk-aversion signal. The 30-day correlation coefficient between BTC and the S&P 500 is only 0.0028, close to zero, showing very weak recent synchronization. A single day's equity move should therefore not be treated as a direct guide to BTC. More useful signals would be a sudden joint rise in the dollar and volatility, or a change in crypto's own fund flows. The current external backdrop is neutral: it is neither a clear drag nor strong enough to offset internal funding contraction.
Five. Overall Assessment
Overall, the 1.00% gain and move back above the 10-day average are the clearest positive signals. However, the 30-day average remains overhead, active sellers still have a slight edge, and ETF outflows plus contracting stablecoin supply both point to limited new purchasing power. The main question is not whether a rebound occurred, but whether transactions and funding can confirm it. Until the evidence aligns more clearly, the market is more likely to search for direction within the recent 24-hour range of 63,337.50 to 64,512.90.
Directional view: Range-bound. This is a conditional conclusion based on the coexistence of price recovery and contracting funds: the short average provides support, while active selling and weaker off-market funding limit follow-through. It does not mean the market will definitely remain in a range.
Assessment horizon: The next 1–3 days. Confirmation conditions: Price holds near the 10-day average of 63,848.33, volume does not contract excessively, price gradually holds the 64,118.86 to 64,512.90 area, and active buy-sell volume strengthens. Invalidation conditions: If price falls below 63,337.50 while active selling intensifies, the range view will weaken; if price holds above 64,512.90 on stronger volume alongside improving flows, an upside break would also invalidate the current range view.
Six. Risk Notice
The current signals cover different time horizons, so short-term readings can change faster than the daily structure. ETF and stablecoin data are also better suited to showing direction than proving immediate causation. Readers should use the alignment of key price levels, volume, and active trading as follow-up confirmation rather than relying on a single indicator. If volatility expands suddenly, price may move beyond the stated range in a short time, in which case fresh data should be used for a new assessment.
Disclaimer: All data in this report comes from the dboqo feature store, as of 2026-08-05 08:55 UTC+8. The cryptocurrency market is highly volatile. This report is only an objective analysis of market conditions and does not constitute investment advice. Investors must assess risks independently and make prudent decisions.