Market Overview
Data context: As of 2026-08-04 08:55 UTC+8, BTC/USDT stood at 63,313.80 USDT, up just 0.02% over the past 24 hours. It traded as high as 64,058.80 and as low as 62,268.20, a range of about 1,791 USDT. Price first rebounded from the low and then returned to the lower-middle part of the range. This shows that the market avoided extending the sharp decline, but it also failed to turn the rebound into a clear breakout. The 24-hour volume was 152,108 BTC, so the sideways action looks like a genuine contest between buyers and sellers rather than inactivity caused by a lack of trading.
The central tension is that active short-term trading improved while price remains capped by the medium-term cost area. The active-flow slope was 91.85 BTC, indicating relatively stronger recent market buying, but the close was still below the 10-day moving average at 63,874.59 and the 30-day moving average at 64,103.58. Buying has helped stabilize the downside, yet it has not proved sufficient to clear overhead pressure. These averages can be viewed as the market's average transaction cost over different periods: until price retakes them, the durability of the rebound still needs confirmation.
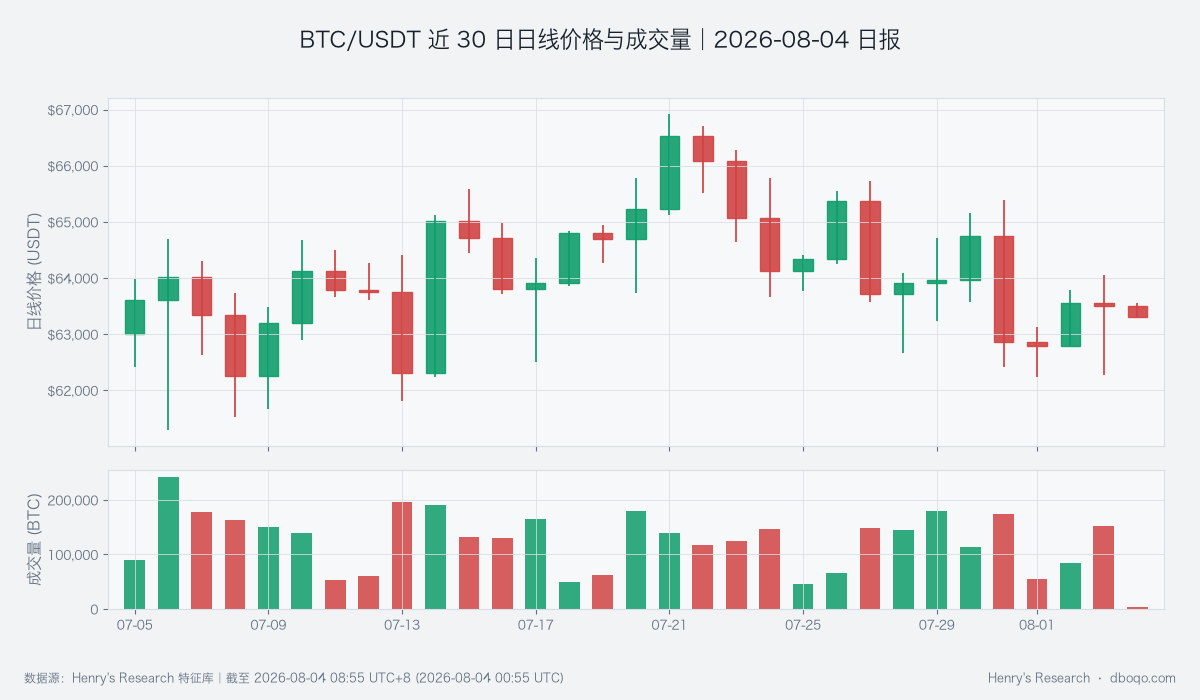
BTC/USDT daily price and volume over the past 30 days, showing price consolidating below both moving averages.
Technical Indicators
The daily relative strength index was 47.32, near the balance point between buyers and sellers. This indicator tracks the speed of gains and losses; a reading near 50 usually means neither side has a pronounced one-way advantage. The daily momentum histogram remained below zero at -190.19 USDT, showing that the earlier downside impulse has not fully recovered. Together, these readings describe a moderately weak medium-term structure without an extreme condition, making continued consolidation more plausible than an immediate trend reversal based on a single rebound.
The shorter-term relative strength index fell to 33.57, close to a commonly watched weak zone. That means the intraday decline has been fast and the marginal room for chasing further weakness may be narrowing, but it is not proof of a reversal by itself. Average daily true range was 1,574.31 USDT, which can be understood as the distance price typically travels in a day. The current 24-hour high-low range was similar, so volatility has not become abnormally disorderly. If price stabilizes around 63,000, the short-term indicator may recover; if it revisits the 62,268.20 area, the weaker structure would remain dominant.
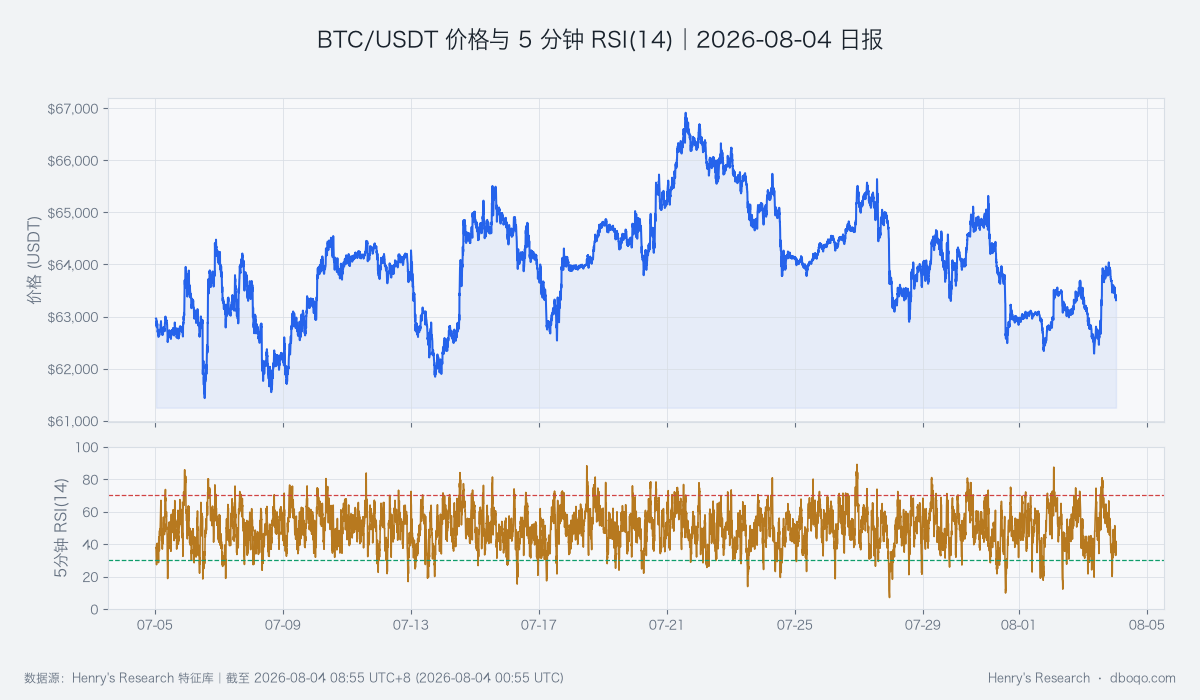
BTC/USDT price over the past 30 days and the 5-minute relative strength index; short-term momentum weakened without confirming a reversal.
Derivatives and Capital Flows
The perpetual-contract funding rate was +0.0031%. This is the periodic cost exchanged between long and short participants; a mildly positive reading means longs are paying a small premium, but conditions are far from clearly crowded. The long-short ratio was 1.48, showing that long participants outnumbered shorts. At the same time, the futures basis versus spot was -0.04%, while open contract exposure fell 0.51%. This combination says sentiment is not pessimistic, but some capital is reducing risk. The rebound is relying more on existing demand, while confirmation from newly added derivatives capital remains limited.
Off-exchange capital signals were more cautious. ETFs recorded a net outflow equivalent to 5.63 hundred million US dollars over 5 days, while stablecoin supply declined 0.86% over 7 days and 0.80% over 30 days. Stablecoin supply can be viewed roughly as nearby cash available to the crypto market; continued contraction means incremental liquidity has not kept pace with the price recovery. ETF flows reflect net subscriptions and redemptions through part of the traditional-finance channel. Both are conditional signals and cannot explain price on their own. The daily quantity proxy for liquidations in the covered BTC perpetual markets was 468.009 BTC, with a 30-day total of 10,713.850 BTC, showing no sudden increase in daily pressure.
Cross-Market Environment
The dollar index was 99.69 and the volatility index was 15.82, so external markets were not pricing obvious panic. A stronger dollar often raises the funding hurdle for risk assets, while a low volatility index points to mild risk aversion in traditional markets. The two forces create a mixed backdrop for BTC. Its 30-day correlation with the S&P 500 was -0.0579, close to zero, meaning their recent tendency to rise and fall together was weak. The direction of equities therefore cannot substitute for examining BTC's own capital flows and price structure.
As a result, the cross-market environment is not the primary driver at present; it is better described as a background condition that has not deteriorated materially. Whether the market can move higher still depends on price reclaiming both moving averages, active buying persisting, and the contraction in ETF and stablecoin liquidity easing. If external volatility rises abruptly while the dollar strengthens, existing internal weaknesses may be amplified. If the external setting remains calm, the market will have more time to absorb selling pressure within the current range.
Overall Assessment
Across distinct data groups, price structure and off-exchange liquidity are the main constraints. Spot remains below the 10-day and 30-day moving averages, daily momentum is still negative, and both ETF and stablecoin signals are contracting. Offsetting support comes from a positive active-flow slope, a short-term relative strength reading near a weak zone, and no sudden rise in the contract-liquidation quantity proxy. These signals counterbalance one another, leaving the market closer to range consolidation than a credible one-way trend.
Directional view: Range-bound. This is a conditional conclusion based on current evidence. Price still faces pressure from both moving averages, while improved active buying and room for a short-term recovery support the downside, so neither side should be treated as a certain outcome.
Assessment horizon: The next 1–3 days. Conditions for validity: Price remains mainly between 62,268.20 and 64,103.58, volume does not expand persistently enough to drive a valid breakout, and funding stays moderate. Invalidation conditions: A volume-backed hold above 64,103.58 together with stronger active buying would shift the range view stronger; a break below 62,268.20 accompanied by expanding contract exposure and worsening flows would shift it weaker.
Risk Notice
Price is not far from either edge of the short-term range, while average daily true range remains above 1,500 USDT, so rapid moves within a single trading period may quickly change short-term indicators and funding. ETF and stablecoin data have their own publication schedules, and cross-market readings can lag unexpected events. The assessment should therefore be treated as a market snapshot at the stated cutoff, with price, volume, and funding conditions checked continuously for validity, rather than as an instruction to trade.
Disclaimer: All data in this report comes from the dboqo feature repository and is current as of 2026-08-04 08:55 UTC+8. Cryptocurrency markets are highly volatile. This report is an objective analysis of market conditions only and does not constitute investment advice. Investors must assess risks independently and make prudent decisions.