Market Overview
Data scope: As of 2026-08-09 08:55 UTC+8, BTC/USDT was at 64,953.00 USDT, up 0.10% over the past 24 hours, with a range of 64,863.50 to 65,163.00 USDT. In plain terms, price was nearly unchanged. The day’s range was also narrow, and repeated tests near 65,000 failed to produce enough sustained force to break the balance. Trading volume over 24 hours was 25,947 BTC, suggesting narrow consolidation rather than a confirmed new directional move.
This consolidation matters because price remains above the 10-day moving average at 64,027.27 USDT and the 30-day moving average at 64,316.75 USDT, so the short- and medium-term cost area is supporting pullbacks. Yet the latest price was only about 210 USDT below the 24-hour high and still failed to clear it decisively, showing that overhead selling pressure remains. Readers should watch both whether support holds and whether 65,163.00 USDT can be cleared sustainably with stronger volume. A small gain alone is not enough to show that the trend has accelerated.
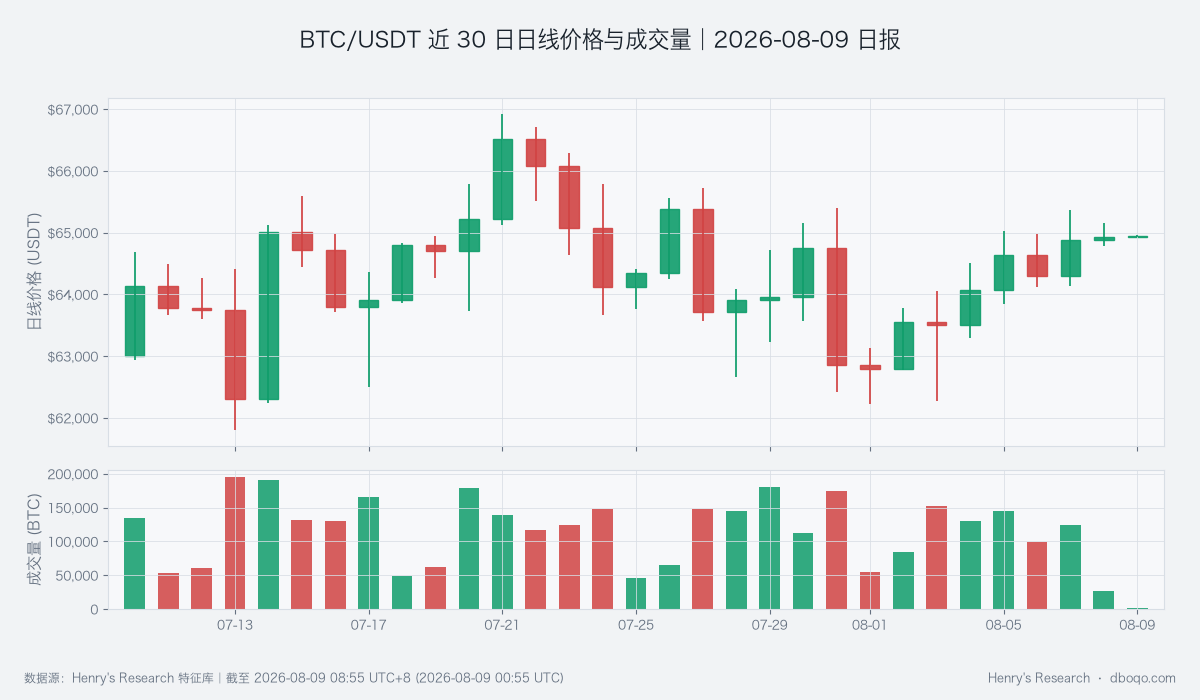
BTC/USDT daily price and volume over the past 30 days
Technical Indicators
The daily RSI was 54.42 and the intraday RSI was 53.86. RSI can be understood as a thermometer for the speed of price gains and losses; a reading near 50 means buying and selling power are broadly balanced. The current readings are slightly above the midpoint but far from overheated. The daily MACD histogram was 73.27 USDT and remained above zero, showing that the recent recovery impulse has not disappeared completely. Still, this reading alone cannot prove that price will keep rising; higher highs and a matching increase in volume are also needed.
The daily ATR was 1,390.98 USDT. ATR measures how wide price typically moves over a period, not its direction. Compared with the actual range of about 299.50 USDT over the past 24 hours, current volatility is clearly compressed, meaning the market is coiling rather than fully releasing movement. Price above both moving averages and a positive MACD histogram provide constructive structural evidence. The narrow range and limited volume, however, show that this advantage has not yet become a clear breakout, so price may continue to digest between the moving averages and the recent high.
Derivatives and Fund Flows
The perpetual funding rate was +0.0044%. This is the payment exchanged between long and short participants to keep contract prices close to spot, and the small positive reading shows that demand from the long side has a slight edge without being crowded. The long-short ratio was 1.15, also showing no extreme concentration, while open interest changed by +0.23%, meaning the total scale of contracts still active in the market increased slightly. At the same time, basis was -0.03%, so contract prices were marginally weaker than spot. New participation therefore did not produce uniformly optimistic pricing, and the derivatives market remained restrained overall.
The active-trade slope was -36.19 BTC, indicating that sellers willing to transact immediately were slightly stronger than buyers, a short-term signal that runs against support from the moving averages. The daily liquidation quantity proxy for the covered BTC perpetual markets was 18.610 BTC, with a 30-day total of 9,321.574 BTC. The daily reading was low and did not show concentrated pressure from forced position closures. Overall, funding and open interest were not overheated, but active selling continued to limit upside. If buyer-initiated activity does not improve, the advantage of holding above the moving averages may continue to erode.
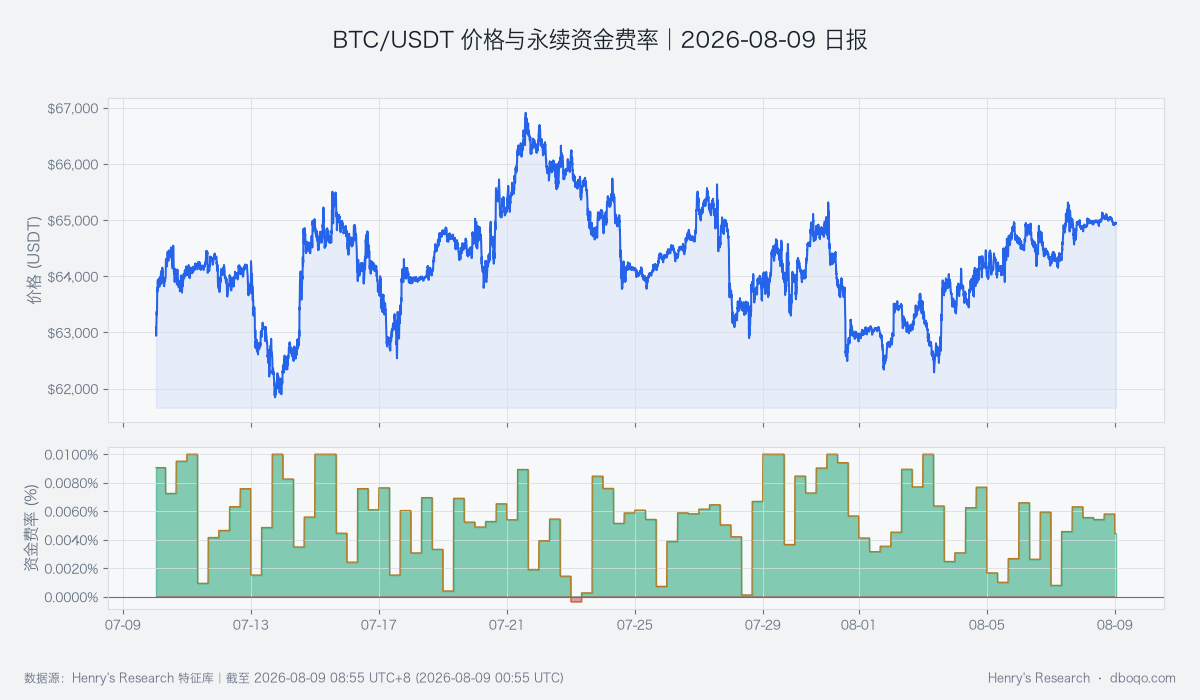
BTC/USDT price and perpetual funding rate over the past 30 days
Cross-Market Environment
ETFs recorded net inflows of 7.97 hundred million US dollars over the past 5 days, showing that net capital has recently entered through external channels and may conditionally support pullbacks. Stablecoin supply grew +0.10% over 7 days, indicating a slight near-term improvement in available liquidity, but it remained down 0.69% over 30 days, showing that the longer-term liquidity base has not fully recovered. These signals are not contradictory: localized inflows can provide a floor without being sufficient for a sustained breakout. The next questions are whether ETF inflows continue and whether the 30-day stablecoin measure stops falling.
The US dollar index was 99.94 and the volatility index was 15.28, indicating that risk-aversion pressure in traditional markets was not elevated. BTC’s 30-day correlation with the S&P 500 was only 0.0117, close to no clear linear relationship. Because these cross-market indicators are lower-frequency observations that may lag, they should be treated only as environmental conditions and cannot explain every intraday move. If external risk appetite stays stable, BTC is more likely to be driven by its own trading and fund flows. A rapid rise in the volatility index, however, could break the current narrow consolidation.
Overall Assessment
The dominant evidence currently comes from price structure and external capital. Spot price is above the 10-day and 30-day moving averages, ETFs have maintained net inflows over the past 5 days, and stablecoin supply has also edged higher over 7 days, so downside support is present. The opposing risks are seller-dominated active trading, a contraction in stablecoin supply over 30 days, and slightly negative basis. Together, these signals show that external inflows have not yet translated into consistent on-market buying. Price has neither lost its moving averages nor cleared the 24-hour high with stronger volume, making a range-bound contest the description most consistent with the current evidence.
Directional view: Range-bound. This is a conditional conclusion based on different data families, including price, funding, and active trading. The moving averages and ETF inflows provide support, while active selling and the longer-term liquidity contraction limit upside. It is not a deterministic forecast.
Assessment horizon: The next 1–3 days. Conditions for validity: Price continues to hold near the 30-day moving average at 64,316.75 USDT, volume remains steady, ETF net inflows do not reverse materially, and active selling gradually weakens. Invalidation conditions: A volume-backed move that holds above 65,163.00 USDT alongside persistently stronger active buying would shift the view toward bullish. A break below the moving-average area from 64,027.27 to 64,316.75 USDT accompanied by expanding selling pressure would shift the range-bound view toward bearish.
Risk Notice
The actual trading range is currently much smaller than the daily ATR. Low volatility may persist, but it may also expand quickly when new information appears. Cross-market data update at different speeds, so ETFs, stablecoins, and correlation provide conditions rather than a single causal explanation. Liquidation data are also a daily quantity proxy for the covered markets, not an immediate picture of every market. Readers should focus on whether the moving-average area, the 24-hour high, trade direction, and fund flows change together, and avoid treating a brief move as a confirmed trend.
Disclaimer: All data in this report are sourced from the dboqo feature repository, as of 2026-08-09 08:55 UTC+8. Cryptocurrency markets are highly volatile. This report is an objective analysis of market conditions and does not constitute investment advice. Investors must assess risks independently and make prudent decisions.