I. Core Finding and Direction: The Weakness Behind the Consolidation Matters More Than the Price Change
Data scope:This report covers BTC market performance through 2026-08-10 20:35 UTC+8 and compares the current 24-hour indicators with the past 180 comparable periods. The main text and charts use the same time range and statistical methodology.
Core finding:BTC declined only 0.03% over the past 24 hours, appearing nearly flat. However, the price has returned to the bottom of its short-term trading range, while volume, momentum, and aggressive buying have provided no confirmation of a reversal. Therefore, the most valuable conclusion in this report is not that “the price barely fell,” but that underlying buying support remains weak despite the calm appearance.
Historical comparison:The price’s position within its recent swing range is only at the historical 1% percentile, versus a historical mean of 0.48. RSI is 31.73, below its historical mean of 49.37 and at the 8% percentile. 24-hour trading volume is 76,224 BTC, less than half its historical mean of 161,685 BTC and only at the 7% percentile. Together, these three sets of evidence indicate a low-volume pause within a weak range rather than a confirmed bottom.
Data-scope review:All values used in the assessment can be compared with historical samples of matching frequency. No anomalies were found in units, frequency, or order of magnitude. Current deviations are treated as market phenomena, and no questionable data were included in the directional assessment.
Directional assessment:The overall assessment for the next 24 hours isBearish. The main evidence is the price’s position at the bottom of the range, weak momentum, insufficient overall volume, and aggressive net buying below normal levels. A weaker US dollar, low VIX, and ETF inflows are the principal counterarguments, so this is only a short-cycle assessment with explicit invalidation conditions.
Assessment horizon:The next 24 hours.Conditions for validity:The price fails to hold above 65,482.70 USDT, while trading volume, RSI, and aggressive net buying remain below their respective historical norms.Invalidation conditions:The bearish assessment should be withdrawn if the price breaks above and holds 65,482.70 USDT on rising volume, while aggressive net buying strengthens materially.
II. Key Market Data: A Flat Price Does Not Mean Buying Support Is Firm
BTC’s latest price is 64,894.50 USDT, with a 24-hour range of 64,794.40 to 65,482.70 USDT. The price change is at the historical 48% percentile and is not itself unusual. What matters is that trading volume is only at the 7% percentile. This means the market currently lacks a strong one-sided impulse, but there is also no substantial capital providing support at lower levels. The priority should be to observe whether a breakout is accompanied by expanding volume, rather than focusing only on whether the price is up or down.
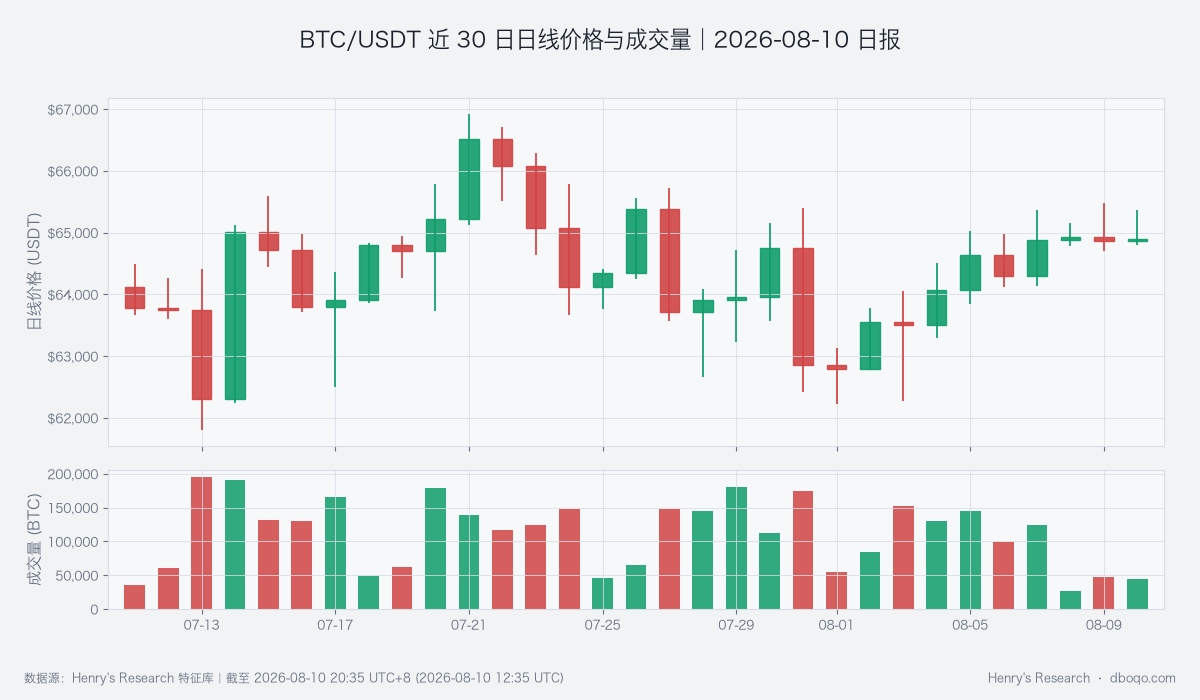
BTC/USDT Daily Price and Trading Volume Over the Past 30 Days
III. Price Action and Trend: Oversold Conditions May Produce a Rebound, but Weakness Remains
RSI has fallen to 31.73, at the historical 8% percentile, indicating that short-term selling pressure is more concentrated than during most periods. This increases the possibility of a technical rebound but cannot by itself confirm a trend reversal. MACD momentum remains below its historical mean, and the price is still in a weak short-cycle zone. Meanwhile, realized volatility is only at the 6% percentile, suggesting that the current calm is likely compression ahead of a directional move rather than the disappearance of risk.
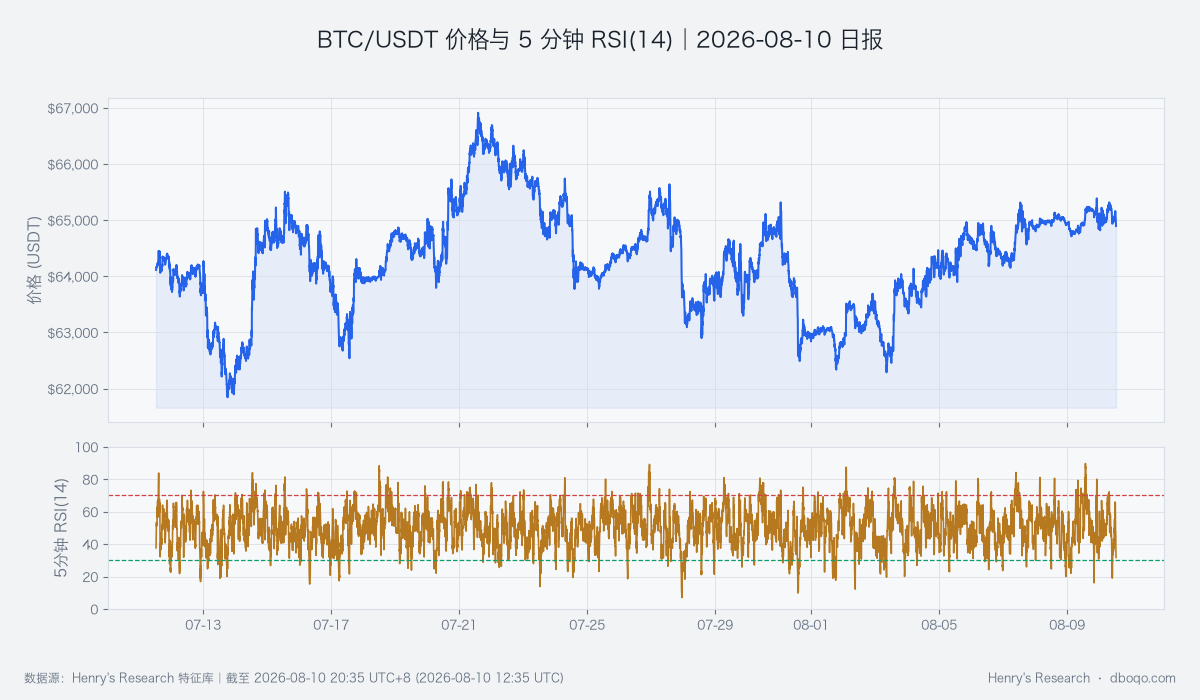
BTC/USDT Price Over the Past 30 Days and 5-Minute RSI(14)
IV. Volume-Price Structure and Fibonacci: Price Is at the Bottom of the Range, but Support Remains Weak
The price’s position within its recent swing range has fallen to the 1% percentile, nearly touching the bottom of the range. Aggressive net-buying intensity is only at the 19% percentile, below its own historical norm. Although the cumulative direction of aggressive buying and selling has improved slightly, this is insufficient to offset weak overall volume and weakness at lower levels. The key point of this section is that “there is localized support without broad confirmation,” rather than interpreting a low price level directly as a bottom.
V. Derivatives Anomalies: Realized Volatility Is Very Low, but the Market Is Pricing Future Volatility
The funding rate is at the historical 91% percentile, indicating that long futures positions remain willing to pay relatively high costs. However, the futures-spot basis remains -0.04%, showing no consistent optimism across spot and derivatives markets. More importantly, the implied-realized volatility spread is at the 95% percentile, while realized volatility is at the 6% percentile. This divergence suggests that the current low-volatility environment may not persist. Once the market selects a direction, the move could be faster than those seen recently.
VI. Cross-Market and Funding Conditions: The External Environment Is Supportive, but Internal Liquidity Has Not Confirmed It
BTC Cross-Market Funding Temperatureis elevated (+0.60). ETFs recorded net inflows of 6.87 hundred million US dollars over the past 5 days, a clear improvement from the historical average net outflow of 0.75 hundred million US dollars. The US dollar environment is at the historical 3% percentile, while VIX is at the 6% percentile, both providing a buffer for risk assets. However, stablecoin supply declined 0.87% over 30 days, weaker than the historical average decline of 0.14%, indicating that funding within the crypto market has not improved in parallel. Therefore, funding conditions provide a bullish counterargument but are insufficient on their own to overturn the short-term bearish assessment.
VII. Combined Signals and Scenario Validation: The Conclusion Is Bearish, but a Break Above the Upper Boundary Should Prompt an Immediate Reassessment
The combined signal is currently bearish, broadly consistent with the price’s range position, RSI, aggressive net buying, and divergence in derivatives. This alignment increases concern that weakness may continue, but ETF inflows and macro risk appetite mean that downside potential should not be extrapolated mechanically. What would overturn the current assessment is not a brief price increase, but the price holding above the upper boundary, volume returning to normal, and aggressive buying improving.
VIII. Risk Notice: Low Volatility Does Not Mean Low Risk
The two most likely misjudgments are treating a low RSI as a guarantee of a rebound or treating ETF inflows as a guarantee that the price will rise. The former only indicates weak short-term momentum, while the latter only indicates improvement in one category of external funding conditions. Both require confirmation from a price breakout, trading volume, and aggressive trading. When realized volatility is historically low, particular attention should be paid to the risk of a rapid upside breakout or downside breakdown following an expansion in volume.
Disclaimer:This report was prepared by dboqo based on market data through 2026-08-10 20:35 UTC+8. Cryptocurrency markets are highly volatile. This report provides only an objective analysis of market phenomena anddoes not constitute investment advice, and investors must assess risks independently and make prudent decisions.