Core Finding and Direction: The Price Surge Masks Aggressive Selling and Pullback Risk
Data context: Data are current through 2026-08-18 08:45 UTC+8. The current window covers the latest aligned 24 hours and is compared with 180 historical 24-hour samples ending at the same time of day. Core finding: BTC rose 2.39% over the past 24 hours, yet the cumulative aggressive-flow slope fell to -193 BTC, showing that aggressive sellers gained the upper hand even as price advanced; the quality of demand behind the rebound was weaker than the headline gain suggests. Historical comparison: The historical mean for this slope is -8 BTC; among 180 comparable periods, only about 7 were as low or lower, making this a rare reading. That means the price-volume divergence is not routine noise and raises the risk of a post-rally pullback. Scope check: All 13 quality checks passed, with no unit, frequency, or scale anomalies and no scope-anomaly candidates requiring exclusion from the directional assessment. Directional view: Bearish; the gain is unusually strong, but aggressive buying did not confirm it, while options markets are also pricing materially higher volatility risk. Assessment horizon: The next 24 hours. Confirmation conditions: Price fails to hold above 64,600.80 USDT while aggressive buying minus aggressive selling continues to weaken. Invalidation conditions: Price breaks decisively above 64,600.80 USDT and holds above 64,200.62 USDT, accompanied by sustained improvement in aggressive buying.
Key Market Data: The Gain Is Striking, but Volume Has Not Expanded with It
BTC stands at 64,350.10 USDT, up 2.39% over the past 24 hours. The historical mean is a decline of 0.02%, and only about 17 of 180 comparable periods posted a larger gain, so this rebound is not ordinary. Trading volume was 138,058 BTC, below the historical mean of 158,161 BTC and still within its normal range. This means the rally reflects a directional price move, not yet broad confirmation through expanding participation. The next test is whether volume rises alongside a breakout; if price keeps climbing while volume stalls, pullback risk will increase further.
Price Action and Trend: Structure Recovered above Both Averages, but Near-Term Momentum Weakened
Price is slightly above the 10-day average at 63,766.80 USDT and the 30-day average at 64,200.62 USDT, indicating that the medium- and short-term structure has only just recovered above support. However, RSI, which gauges the speed of gains and losses, stands at 43.33 versus a historical mean of 50.19 and below roughly 73% of comparable periods. Better price positioning without stronger momentum is an important contradiction behind the bearish view. A break below 64,200.62 USDT would risk sending the recovery quickly back into a range; a renewed rise in RSI alongside price would show that the divergence is easing.
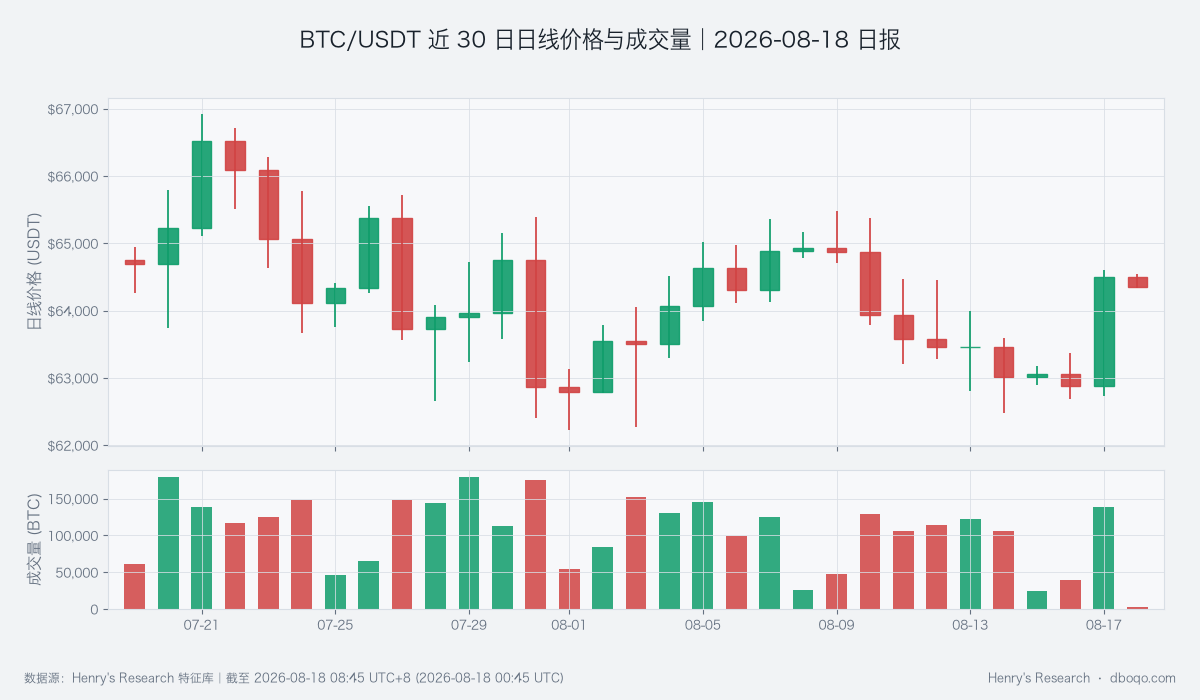
BTC/USDT daily price and volume over the past 30 days: testing whether the rebound gains sustained volume confirmation
Price-Volume Structure and Price Range: Aggressive Selling Undermines Breakout Credibility
The cumulative aggressive-flow slope is -193 BTC versus a historical mean of only -8 BTC. Aggressive net-buying strength also fell to -1.24, with only about 9 of 180 comparable periods as low or lower. Together, these readings show that current trading is tilted toward aggressive selling, reducing the credibility of a break through the 64,600.80 USDT upper boundary. Initial support is at 64,200.62 USDT, followed by 63,766.80 USDT. Only a clear recovery in aggressive buying minus aggressive selling would give a sustained break above the upper boundary greater significance.
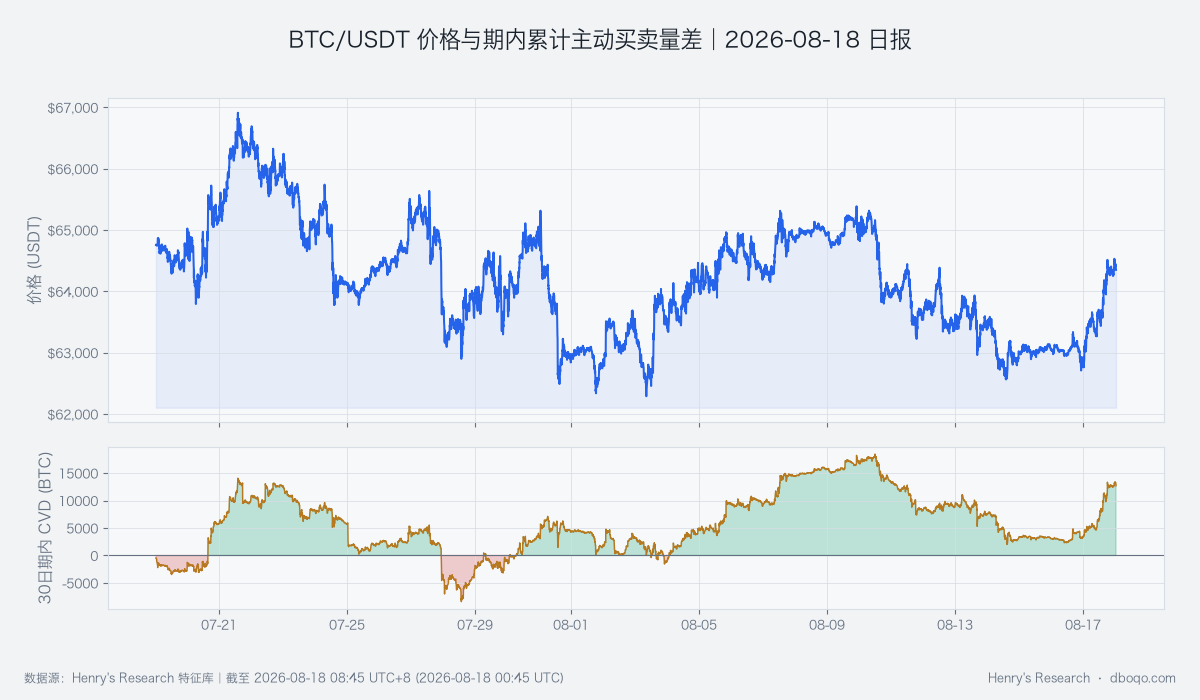
BTC/USDT price and cumulative aggressive buying minus aggressive selling over the past 30 days: testing whether the price advance has genuine buying support
Derivatives Anomaly: A Rarely High Volatility Premium Increases Reversal Sensitivity
The implied-versus-realized volatility spread is +8.95 against a historical mean of -1.48; among 180 comparable periods, only about 4 were higher. This measure compares the future volatility priced by options with recent actual volatility. Its current elevation means the market is paying a substantial premium for a larger move ahead, although it does not identify whether that move will be up or down. In combination with aggressive selling, it increases sensitivity to a pullback. The warning would ease if the spread falls and price holds 64,200.62 USDT.
Cross-Market and Capital Conditions: Macro Support Has Not Become Sustained Inflows
BTC cross-market capital conditions are neutral. An unusually weak dollar and a VIX reading below roughly 79% of comparable periods provide a supportive backdrop for risk assets. However, ETFs recorded a net outflow of 3 hundred million US dollars over the past 5 days versus a historical mean net outflow of 0.77 hundred million US dollars, while stablecoin supply growth over 7 days and 30 days was -0.19% and -0.97%, respectively. This shows that capital available to enter the market is not expanding consistently. Macro conditions can therefore cushion downside pressure but cannot establish that the rebound will persist. The next test is whether ETF flows and stablecoin supply improve together.
Composite Signal and Scenario Validation: Price-Volume Evidence and Risk Pricing Both Lean Bearish
The composite signal is bearish, consistent with aggressive selling, weak momentum, and the high volatility premium, but not fully aligned with the 2.39% price gain and weaker dollar; the conclusion is therefore conditional. The base case is for price to stall near 64,600.80 USDT and fall back toward 64,200.62 USDT. A subsequent break below 63,766.80 USDT would provide further confirmation. Conversely, a volume-backed break above 64,600.80 USDT, accompanied by stronger aggressive buying and warmer capital conditions, would invalidate the current view.
Risk Notice
The current price gain, aggressive trading structure, and options risk pricing conflict with one another, so short-term volatility may be materially above normal. A weaker dollar could extend the rebound, while ETF and stablecoin contraction could amplify a pullback; no single indicator provides a deterministic conclusion. The key variables are the quality of a break above 64,600.80 USDT, support at 64,200.62 USDT, and changes in aggressive buying. Unexpected macro news could also invalidate the range.
Disclaimer: This report was prepared by dboqo using market data available through 2026-08-18 08:45 UTC+8. Cryptocurrency markets are highly volatile. This report provides objective analysis of market conditions only and does not constitute investment advice. Investors must assess risks independently and make prudent decisions.