I. Core Finding and Direction: Local Price-Volume Strength Is Constrained by Thin Total Volume
Data context: The observation window ends on month 8, day 17 of 2026 at 09:25 (UTC+8). The current period covers the preceding 24 hours and is compared with as many as 180 historical 24-hour samples ending at the same time of day. Core finding: Local relative trading activity rose to +1.11, above its historical mean of +1.03; only about 3 of 180 comparable periods were higher, showing that short-term trading accelerated markedly. Yet total volume over 24 hours was just 45,735 BTC, far below the historical mean of 158,739 BTC, with only about 3 periods equally low or lower. Together, these readings mean activity was concentrated in a few intervals instead of becoming a sustained increase in volume—the period's central price-volume contradiction. Historical comparison: Realized volatility over 48 periods was only +0.03%, versus a historical mean of +0.11%; only about 2 of 180 comparable periods were equally low or lower. Meanwhile, the implied-versus-realized volatility spread reached +9.52, compared with a historical mean of -1.63, with only about 2 periods higher. This shows unusually calm spot movement alongside elevated expectations for future volatility. Scope review: All 13 quality checks passed. No anomaly in units, frequency, or magnitude was found, and no scope-anomaly candidate had to be excluded from the directional assessment. Directional view: Bullish, but conditional on confirmation from volume. Time horizon: The next 24 hours. Confirmation conditions: Price must break decisively above 63,370.00 USDT, active buying must persist, and total volume must leave its rare low. Invalidation conditions: Price falls below 62,681.10 USDT, or local activity fades while active selling regains control.
II. Key Market Data: A Narrow Advance Lacks Confirmation from Total Volume
BTC last traded at 63,093.40 USDT, up +0.11% over 24 hours, within a range of 62,681.10 to 63,370.00 USDT. Price closed slightly higher without leaving the range, indicating that buyers have a modest advantage but have not secured a decisive breakout. This matters because a small advance can be magnified by individual trades when total volume is exceptionally low. The upper and lower boundaries should now serve as validation levels: an upside break needs sustained improvement in volume, while a downside loss would show that the current bullish signal lacks support.
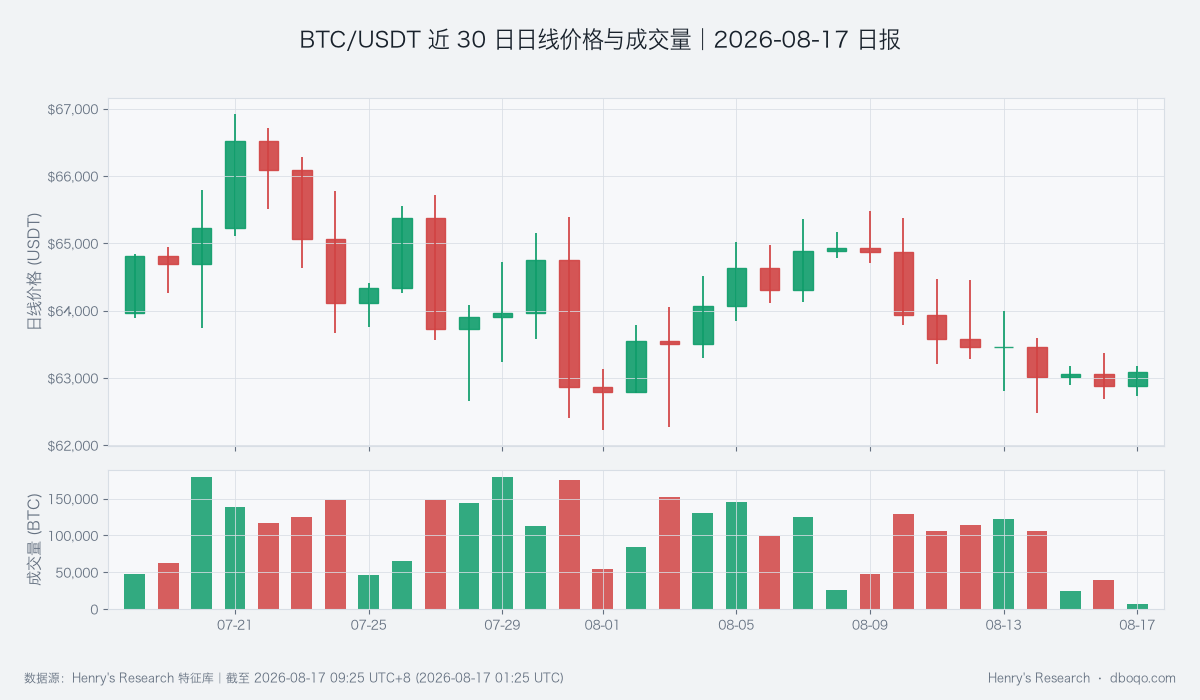
BTC/USDT price and volume over the past 30 days: watch whether a price breakout receives sustained volume support
III. Price Action and Trend: Short-Term Momentum Improves, but Daily Moving Averages Remain Resistance
The short-term price-deviation reading was +2.26, compared with a historical mean of -0.14, and only about 8 of 180 comparable periods were higher. The short moving-average spread also rose to +99.87 USDT, above roughly 81% of comparable periods, confirming warmer near-term momentum. RSI measures the balance of upward and downward momentum; its short-term reading of 61.92 exceeded the historical mean of 49.02, showing buyer control without an extreme condition. The important counterweight is that spot price remains below the 10-day moving average at 63,804.93 and the 30-day moving average at 64,210.71, so the daily trend has not reversed. Unless price reclaims both averages in sequence, the short-term strength is more likely to remain a rebound within the range.
IV. Price-Volume Structure and Price Range: Active Buying Improves, but the Upper Area Needs Sustained Demand
Active net-buying strength was +0.49, against a historical mean of only +0.01, and stood above roughly 83% of comparable periods. This measure compares the strength of market buy orders with market sell orders, so the current result shows that the local rise was not caused solely by drifting quotes. At the same time, price stood at 0.83 within its recent range, versus a historical mean of 0.48, with only about 18 of 180 comparable periods higher. Both readings support a bullish view, but they also concentrate risk near the upper part of the range. If active buying continues and total volume expands with it, confidence in a breakout will improve; if buying weakens, the elevated range position could instead amplify a pullback.
V. Derivatives Anomaly: Options Price More Volatility, While Contract Capital Has Not Chased the Advance
The implied-versus-realized volatility spread was +9.52, compared with a historical mean of -1.63, and only about 2 of 180 comparable periods were higher. Implied volatility reflects the options market's pricing of future movement, while realized volatility describes movement that has already occurred. Their unusually wide gap means the market is paying more for a possible range break, but it does not predict the direction. The average funding rate of +0.002780% remained near its historical norm, while open-contract interest changed by -0.45%, weaker than its historical mean of +0.26%. Derivatives capital therefore has not clearly chased the rise. The next test is which side price chooses when volatility expands and whether contract size rises with the breakout.
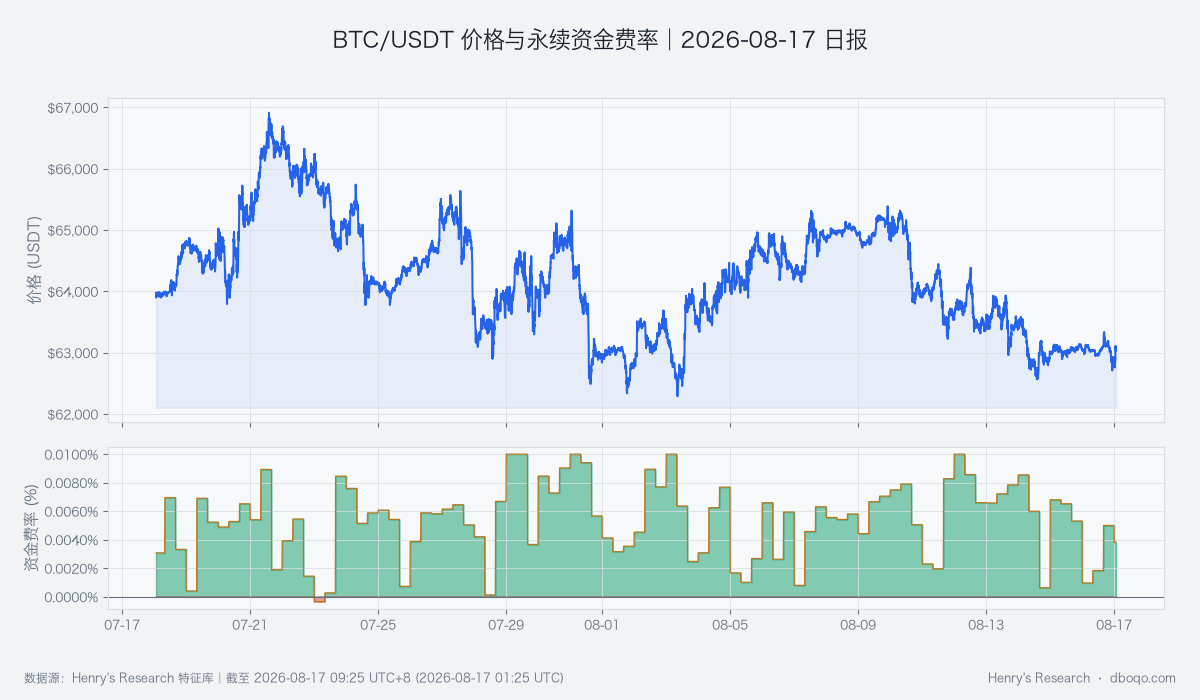
BTC/USDT price and perpetual funding rate over the past 30 days: funding remains normal and does not yet show crowded momentum buying
VI. Cross-Market and Capital Flows: A Supportive Macro Backdrop Meets Cautious Crypto Liquidity
The BTC cross-market capital temperature was neutral at +0.22. A softer dollar and lower market fear provide an external cushion for risk assets, but ETFs recorded a net outflow of 3.61 hundred-million US dollars over the past 5 days, compared with a historical mean net outflow of 0.76 hundred-million US dollars. Stablecoin supply growth over 30 days was -0.93%, also weaker than the historical mean of -0.10%, showing that deployable crypto liquidity is still contracting. This combination matters because a supportive macro backdrop can reduce downside pressure but cannot by itself drive a sustained BTC advance. The capital evidence will align with the bullish price-volume view only if ETF flows improve and stablecoin contraction eases; otherwise, the capital temperature remains merely neutral.
VII. Composite Signal and Scenario Validation: The Bullish Consensus Needs Volume Confirmation
The composite signal is bullish and agrees with the short-term moving averages, active buying, and price's position near the upper part of its range. It does not fully agree with exceptionally low total volume, resistance from daily moving averages, or contracting crypto liquidity, so the modest rise should not be extrapolated directly into a trend reversal. The base case for the next 24 hours is another test of 63,370.00 USDT. A breakout that holds while trading volume and contract size improve would strengthen the bullish assessment. If price surges and then returns to the range, local activity was only briefly concentrated. A break below 62,681.10 USDT would directly invalidate the current view and shift the risk from an unusually low-volatility release toward the downside.
VIII. Risk Notice
The principal risk is the simultaneous presence of low realized volatility, low total volume, and expensive options-implied volatility; a breakout may therefore unfold faster than usual. Relationships among ETFs, stablecoins, the dollar, and market fear are conditional and do not establish a single cause. Derivatives readings may also adjust only after price moves quickly. Readers should focus on the range boundaries, whether total volume improves persistently, and whether capital-flow evidence confirms the same direction.
Disclaimer: This report was prepared by dboqo using market data available through month 8, day 17 of 2026 at 09:25 UTC+8. Cryptocurrency markets are highly volatile. This report provides objective analysis of market conditions only, does not constitute investment advice, and readers must assess risks independently and make prudent decisions.