One. Core finding and direction: option risk pricing is rising without spot-market confirmation
Data context: This report uses data through 2026/8/19 09:05 (UTC+8). The current window covers the preceding 24 hours, and the historical comparison uses 180 comparable 24-hour samples aligned to the same cutoff, with consistent units and frequencies throughout. Core finding: Price rose only modestly, yet options priced substantially more future volatility than the market recently realized, while open interest contracted sharply. This suggests that higher risk pricing is not supported by sustained growth in participation and looks more like a defensive premium than confirmation of a trend. Historical comparison: The implied-realized volatility spread stands at +9.22 versus a historical mean of -1.38; only about 3 of the 180 comparable periods were higher, placing it at a rare high. Open interest fell 3.77% versus an average increase of 0.24%; only about 10 periods were as low or lower, making the retreat in participation unusual. Scope check: All 13 quality checks passed, with no unit, frequency, or magnitude anomalies and no scope-anomaly candidates requiring exclusion from the directional assessment. Directional view: Bearish. Assessment horizon: The next 24 hours. Conditions for the view: Price fails to break decisively above 65,057.90 USDT, volume remains below its historical norm, and open interest does not recover. Invalidation: Price holds above 65,057.90 USDT on stronger volume, participation expands, and active buying provides sustained follow-through.
Two. Key market data: price edged higher but trading activity lacked scale
BTC/USDT was at 64,517.60 USDT, up 0.38% over the past 24 hours and trading between 63,979.20 and 65,057.90 USDT. The gain was higher than roughly 62% of comparable periods, only modestly above normal, which means price alone has not established a strong trend signal. The next test is whether the upper boundary can be broken decisively rather than treating a small daily gain as trend continuation. Volume was 97,749 BTC versus a historical mean of 158,017 BTC, lower than about 79% of comparable periods. Thin activity makes an advance easier to disrupt with selling, so any breakout without a clear increase in volume would remain less credible.
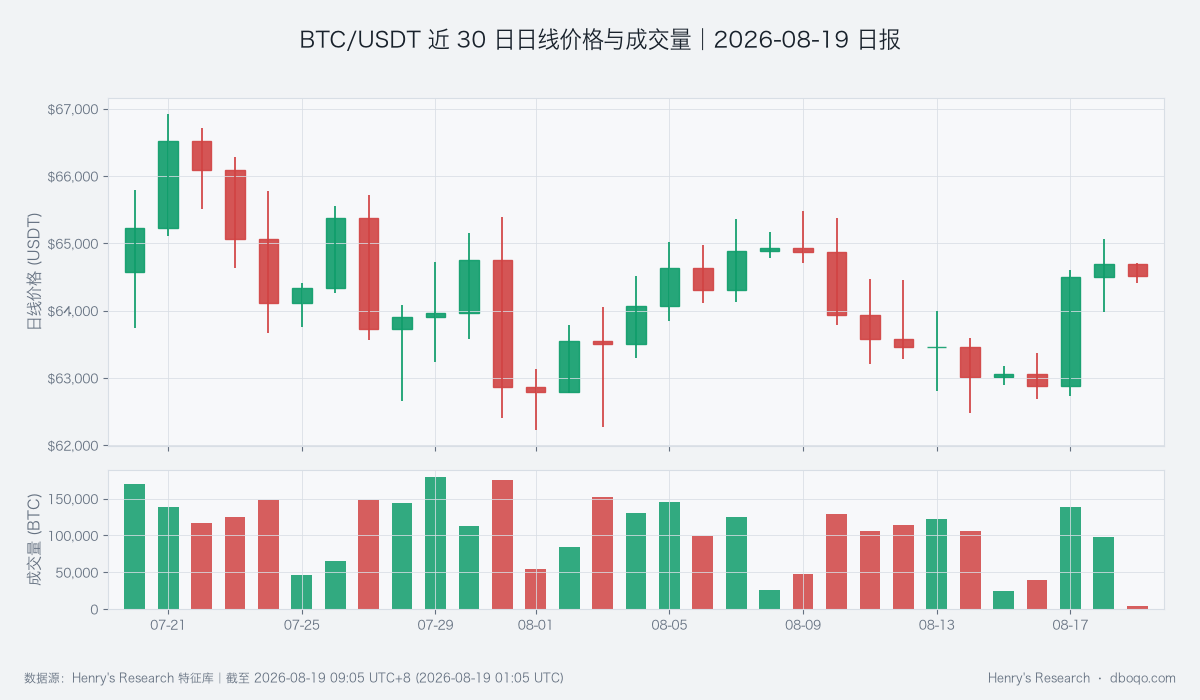
BTC/USDT 30-day price and volume: watch whether a price breakout receives volume confirmation
Three. Price action and trend: the daily position improved while short-term momentum stayed soft
Price is above the 10-day moving average at 63,743.35 USDT and the 30-day moving average at 64,200.60 USDT, showing that the daily structure has improved from earlier levels. However, short-horizon RSI is 43.31 versus a historical mean of 50.10 and is lower than about 74% of comparable periods. RSI gauges the balance of upward and downward momentum, and the current reading means buyers have not established a persistent, dominant advantage. Holding above the moving averages is a bullish counterpoint, but unless short-term momentum returns toward 50 with better volume, that position is more likely to provide a range buffer than a trend breakout strong enough to overturn the bearish view.
Four. Price-volume structure and range: active buying is strong but has not produced a breakout
Active net-buy intensity is +1.67 versus a historical mean of -0.02, with only about 7 of 180 comparable periods higher, showing aggressive demand during localized intervals. This is the most important counterevidence because it indicates that demand exists below the market. Yet the cumulative slope of active buying minus active selling remains -31 BTC versus a historical mean of -14 BTC and is only within the normal range, so the bid has not proved durable. The recent price-range amplitude is 0.54% versus a historical mean of 1.25%, lower than about 85% of comparable periods and evidence that the market remains compressed. If active buying persists and expands the range upward, the bearish view would weaken; if the bid fades quickly, thin activity would make a decline easier to amplify.
Five. Derivatives dislocation: a higher risk premium accompanies shrinking participation
Implied volatility captures the future movement priced into options, while realized volatility describes recent actual price movement. Their spread has widened to +9.22 from a historical mean of -1.38, with only about 3 comparable periods higher. At the same time, realized volatility is only 0.06% versus a historical mean of 0.11%, lower than about 89% of comparable periods. Together, these readings mean the options market is paying a notable premium for potential movement that has not yet appeared in spot trading. The 3.77% decline in open interest further indicates that risk exposure is being reduced. If price breaks out on stronger volume and participation recovers, the premium may be realized through a trend; if price stays range-bound while the premium remains elevated, the risk of volatility releasing to the downside deserves attention.
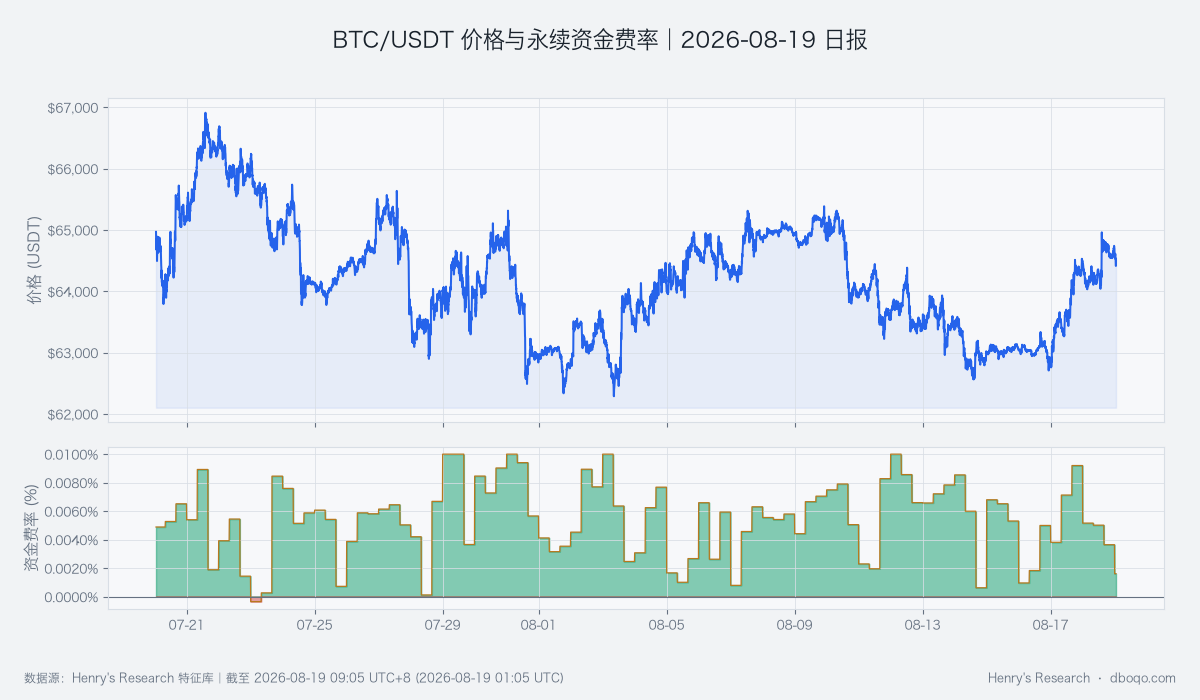
BTC/USDT 30-day price and perpetual funding rate: watch whether derivatives pricing receives confirmation from the price trend
Six. Cross-market and capital conditions: short-term inflows and medium-term contraction offset each other
BTC cross-market capital temperature: The combined reading is neutral. ETFs recorded a 5-day net inflow of 1.29 hundred-million US dollars, higher than about 62% of comparable periods, indicating mild support from traditional capital channels. The 7-day stablecoin supply grew 0.26%, higher than about 73% of comparable periods, which also supports near-term liquidity. But the 30-day stablecoin supply contracted 0.96%, lower than about 66% of comparable periods, showing that the medium-term funding base is still shrinking. A historically weak dollar generally reduces an external headwind for risk assets, while VIX, a measure of expected US equity volatility, is near normal and does not signal additional panic. These forces offset each other, so capital conditions can cushion downside risk but are not sufficient on their own to overturn the volume and derivatives evidence.
Seven. Composite signal and scenario test: the bearish consensus still needs price confirmation
The composite signal is bearish and broadly consistent with low volume, weak short-term momentum, contracting open interest, and a rising options volatility premium. However, active net buying is at a rare high, price remains above the main daily moving averages, and cross-market capital temperature is neutral, so this is not a one-sided conclusion. The base case is for price to remain below 65,057.90 USDT and retest the area near 64,200 USDT, with the durability of active demand on any decline as the key observation. A high-volume break above the range accompanied by renewed participation would invalidate the bearish signal; a break below 63,979.20 USDT with weaker buying would make it more likely that the risk premium turns into a clearer downside move.
Eight. Risk warning
The main uncertainty is the coexistence of low realized volatility and high option-implied risk pricing. A compressed market can expand quickly when news or liquidity conditions change. Active buying, ETF inflows, and a weaker dollar may delay a decline or bring forward a breakout; conversely, persistently low volume increases sensitivity to large trades. The assessment should therefore depend on whether a range break, volume, and participation move together, rather than treating any single indicator as deterministic.
Disclaimer: This report was prepared by dboqo using market data through 2026-08-19 09:05 UTC+8. Cryptocurrency markets are highly volatile. This report provides an objective analysis of market conditions only and does not constitute investment advice. Investors should assess risks independently and make prudent decisions.