One. Core Finding and Direction: Price and Volume Rose, but Aggressive Selling Disagreed
Data context: As of 2026-08-20 09:05 UTC+8, this report examines the latest 24 hours against 180 historical 24-hour windows aligned to the same cutoff. Historical positions use consistent units, frequencies, and aggregation methods.
Core finding: BTC gained 7.41% over the past 24 hours and volume expanded to 331,398 BTC, yet the cumulative aggressive buy-minus-sell slope fell to -802 BTC. Price and total activity looked strong, but trade direction showed that selling into the advance intensified markedly. This is the central contradiction and means the gain alone does not confirm that the rise can continue.
Historical comparison: The historical average price change is close to 0.00%, with no higher observation among 180 comparable periods. Volume averaged 157,714 BTC, with only about 4 periods higher. Meanwhile, the cumulative aggressive buy-minus-sell slope averaged -15 BTC, with only about 1 period as low or lower. The divergence between expanding price-volume activity and trade direction therefore resembles accelerated turnover near the highs more than an uncontested trend confirmation.
Scope check: All 13 data-quality checks passed. No unit, frequency, or magnitude anomaly was found, and no scope-anomaly candidate had to be excluded from the directional assessment. These extreme historical positions are treated as market moves.
Directional view: The baseline for the next 24 hours is bearish. Momentum from the sharp rise may persist, but aggressive selling and options risk pricing together reduce the odds of successful upside chasing. Assessment horizon: the next 24 hours. Confirmation conditions: price fails to hold above 70,450.00 USDT and aggressive buys minus sells remain negative. Invalidation conditions: price establishes support above 70,450.00 USDT while the cumulative aggressive buy-minus-sell slope turns clearly positive with sustained volume.
Two. Key Market Data: The Volume-Backed Surge Shifted Validation to the Intraday High
BTC last traded at 69,296.50 USDT within a 24-hour range of 64,131.30 to 70,450.00 USDT, up 7.41%. The wide range and 331,398 BTC of volume show a clear rise in participation. This matters because price has already absorbed a rapid advance; the next test is whether 70,450.00 USDT can turn from a spike high into effective support. If price returns to the middle or lower part of the range, the rare volume surge would look more like ownership transfer than fresh demand.
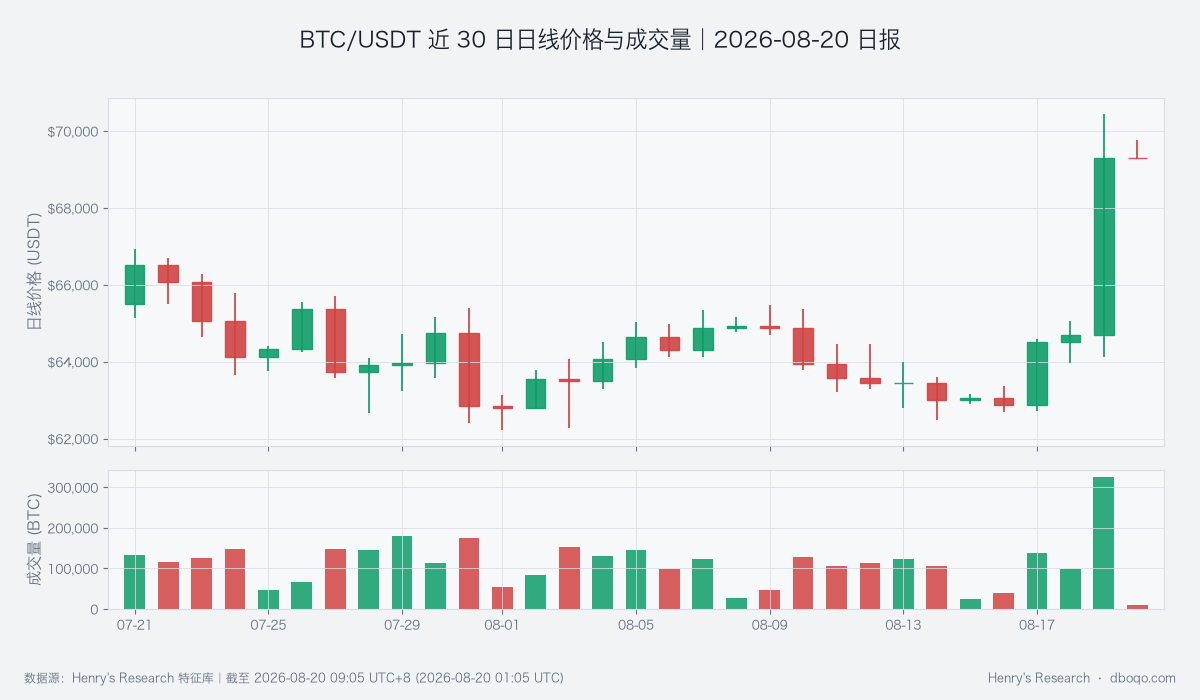
BTC/USDT price and volume over the past 30 days
Three. Price Action and Trend: The Daily Breakout Is Strong, but Short-Term Momentum Is Cooling
The current price stands well above the 10-day moving average at 64,187.57 USDT and the 30-day moving average at 64,336.77 USDT, so the daily trend retains an upward foundation. However, the daily Relative Strength Index is 73.65, indicating that the recent pace of gains has entered a heated zone, while the more sensitive short-term reading has fallen to 44.55. This split shows that the broader structure has just shifted higher as near-term chasing cools. If price holds above both averages and short-term momentum rises again, the bearish view will weaken; if intraday rebounds continue to fail below the prior high, retracement risk deserves more weight.
Four. Price-Volume Structure and Price Range: Extreme Aggressive Selling Weakens Breakout Quality
The cumulative aggressive buy-minus-sell slope is -802 BTC, far below its historical average of -15 BTC; only about 1 of 180 comparable periods was as low or lower. This indicator measures the direction of aggressive trading, and a deeply negative reading means aggressive sells exceeded aggressive buys during the advance. That is critical to breakout quality because even very high total volume can reflect intense two-way turnover. Price is now in the upper part of the 64,131.30 to 70,450.00 USDT range. The next observation is whether the negative slope improves before price does; if the divergence persists, a retreat toward the middle of the range becomes more likely.
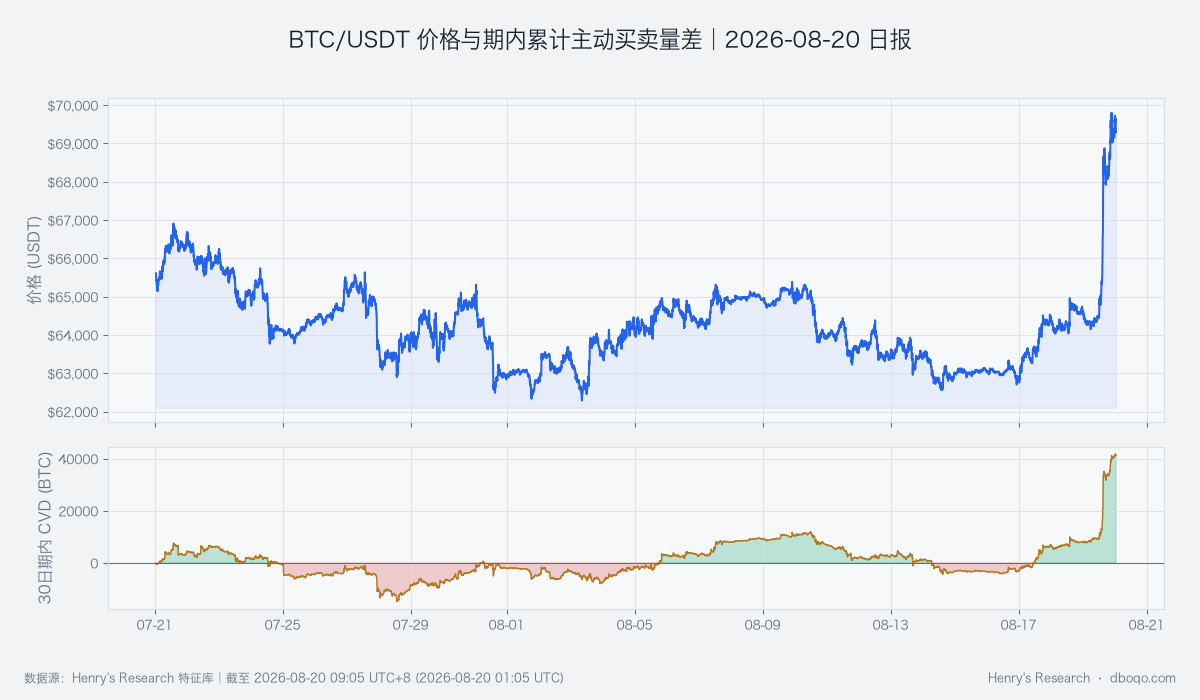
BTC/USDT price and cumulative aggressive buys minus aggressive sells over the past 30 days
Five. Derivatives Anomaly: The Options Volatility Premium Signals Demand for Drawdown Protection
The implied-minus-realized volatility spread climbed to +10.91 versus a historical average of -1.25, with only about 1 of 180 comparable periods higher. It compares volatility implied by option prices with recent realized volatility. An unusually large positive reading means the market is paying a clear premium for future uncertainty. This does not guarantee a price decline, but it shows that two-way risk has been materially repriced after the surge. The latest funding rate is +0.009655%; longs are paying, although this alone does not show extreme crowding. If the volatility premium stays high while price loses 69,296.50 USDT, the bearish evidence strengthens. If the premium falls as price breaks the prior high, the warning will ease.
Six. Cross-Market and Capital Conditions: Inflow Support Has Not Become a One-Way Tailwind
The BTC cross-market capital pulse is neutral. 5-day ETF flows show a net inflow of USD 3.74 hundred million, above the historical average net outflow of USD 0.72 hundred million, providing a cushion for price. However, stablecoin supply growth over 7 and 30 days is -0.12% and -0.97%, respectively, indicating that liquidity available to the crypto market is not expanding convincingly. The US Dollar Index is softer at 99.60 and VIX is 15.91, so the macro backdrop is not clearly tightening, but it is also not moving in unison with crypto capital. The next test is whether ETF inflows persist and stablecoin growth stabilizes. Both would need to improve for the capital pulse to turn warmer and challenge the bearish baseline.
Seven. Composite Signal and Scenario Validation: The Bearish View Awaits Confirmation from Price and Buying
The composite signal is bearish, consistent with the warnings from aggressive selling and the options volatility premium, but in conflict with the 7.41% gain and rare volume expansion. The conclusion is therefore conditional, not a definitive trend reversal call. The base case is that price digests the advance below 70,450.00 USDT and tests demand around 69,296.50 USDT. A weaker case would see persistent aggressive selling pull price toward the middle of the range. The contrary case requires price to hold above the prior high, the cumulative aggressive buy-minus-sell slope to turn positive, and the capital pulse to warm. No single improvement is enough to overturn the view; all three together would offer more reliable evidence of upside continuation.
Eight. Risk Notice: An Extreme Gain Coexists with Elevated Volatility Pricing
The market currently combines a rare price gain and volume expansion with extreme aggressive selling and a high options volatility premium, so price may reverse rapidly in either direction. Historical comparisons describe relative position rather than guarantee repetition. ETF flows, stablecoins, the dollar, and volatility must also be interpreted conditionally and cannot establish a single causal chain. Key risks include a false breakout near the prior high, a rapid contraction in liquidity, and an abrupt shift in cross-market risk appetite.
Disclaimer: This report was prepared by dboqo using market data available as of 2026-08-20 09:05 UTC+8. Cryptocurrency markets are highly volatile. This report provides objective analysis of market conditions only and does not constitute investment advice. Investors must assess risks independently and make prudent decisions.