I. Core Finding and Direction: Strong Volume Supports the Rally, but Active Selling Still Disagrees
Data scope: As of 2026-08-21 09:05 UTC+8, this report examines the latest 24 hours and compares them with 180 historical 24-hour windows aligned to the same cutoff time. The current and historical samples use consistent units, frequencies, and statistical methods.
Core finding: BTC gained 6.65% in 24 hours while volume expanded to 299,408 BTC, showing that the advance was not driven solely by thin trading. However, the cumulative slope of active buying minus active selling fell to -329 BTC, indicating that active trading flows did not confirm the new price high. The market's central tension is therefore strong price and aggregate volume alongside weak active buying.
Historical comparison: The historical mean price change is only 0.03%, and just about 2 of the 180 comparable periods were higher than the current reading. The historical mean volume is 158,327 BTC, with only about 8 periods higher. Meanwhile, the historical mean cumulative active buy-minus-sell slope is -19 BTC, and only about 6 periods were as low or lower than the current reading. This means both the advance and participation are rare, but internal absorption is more fragile than the headline gain suggests. The next confirmation must come from a recovery in active buying.
Scope review: All 13 quality checks passed. No unit, frequency, or magnitude anomalies were found, and there are no scope-anomaly candidates that must be excluded from the directional assessment. The extreme readings are therefore treated as genuine market moves.
Directional view: The combined evidence is bullish, although the active-flow divergence lowers confidence. Assessment horizon: The next 24 hours. Validation condition: Price holds near 72,900 USDT and extends above 73,985.80 USDT while active buying minus active selling improves materially. Invalidation condition: Price falls back into the 68,882.10—72,900 USDT range as active selling expands, or the capital temperature rapidly shifts from warm to cool.
II. Key Market Data: Price and Participation Confirm Unusually Active Trading
The latest price is 73,906.60 USDT, the 24-hour range is 68,882.10—73,985.80 USDT, and the gain is 6.65%. Price is near the top of the range, showing that buyers still control the short-term rhythm. More importantly, volume of 299,408 BTC is about eight-tenths above the historical mean of 158,327 BTC, with only about 8 comparable periods higher, indicating broad participation in the breakout. If price moves above 73,985.80 USDT while aggregate volume quickly contracts, breakout quality will weaken. If it holds near 72,900 USDT after the expansion in volume, the upward structure becomes more credible.
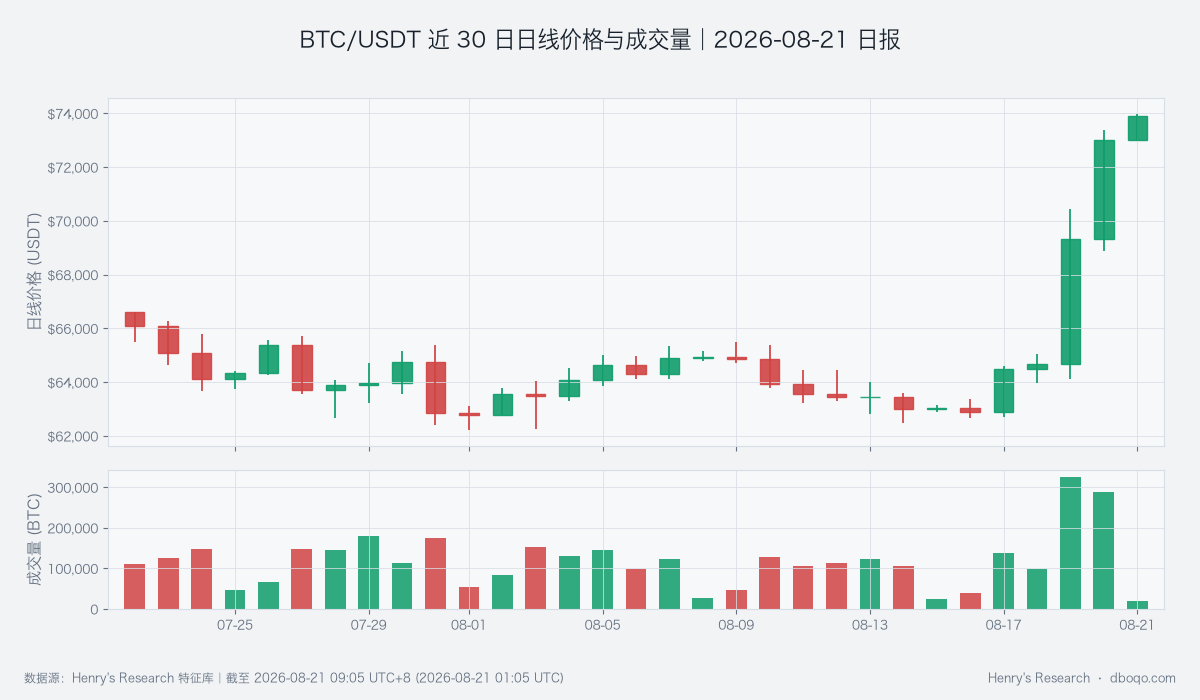
BTC/USDT price and volume over the past 30 days: expanding participation supports the breakout, but high-level absorption still needs confirmation.
III. Price Action and Trend: Bullish Moving-Average Expansion Meets Overheated Momentum
The short-term moving-average spread widened to +476.11 USDT from a historical mean of only +1.67 USDT; just about 1 of the 180 comparable periods was higher, showing that the trend slope has strengthened markedly. RSI measures the balance between upward and downward momentum. It now stands at 73.39, well above its historical mean of 49.96, with likewise only about 1 period higher. Together they support the bullish view, but the elevated RSI also means that sustaining the advance requires more incremental buying. The next test is whether sideways consolidation can absorb the strong momentum instead of an abrupt decline doing the adjustment.
IV. Price-Volume Structure and Range: Aggregate Volume Has Not Yet Produced Active-Buy Confirmation
Price is close to the top of the observed 68,882.10—73,985.80 USDT range, and expanding aggregate volume should normally raise confidence in a breakout. The opposing evidence is the -329 BTC cumulative slope of active buying minus active selling, versus a historical mean of -19 BTC; only about 6 comparable periods were as low or lower. This measure identifies whether aggressive trading is led by buyers or sellers, and its negative value shows strong sell-side absorption at high prices. A recovery toward the historical norm would make a move above the range more durable. A further decline would warn of a failed breakout even if price briefly makes another high.
V. Derivatives Anomalies: Risk Pricing Is Rising and the Cost of Chasing the Rally Is Increasing
The average funding rate over the past 24 hours is +0.009464%, versus a historical mean of +0.001936%, with only about 2 comparable periods higher. This shows a marked rise in willingness to pay for long exposure. Basis is the difference between perpetual or futures prices and spot. It is now -0.04%, narrower than the historical mean of -0.05%, but it remains a discount, so derivatives do not unconditionally confirm spot strength. The implied-minus-realized volatility spread is +10.83 versus a historical mean of -1.10, and only about 2 periods were higher. This spread shows how expensive option-implied movement is relative to realized movement, meaning the market is paying more for the prospect of another large move. If funding keeps rising while price stalls, crowding risk will increase.
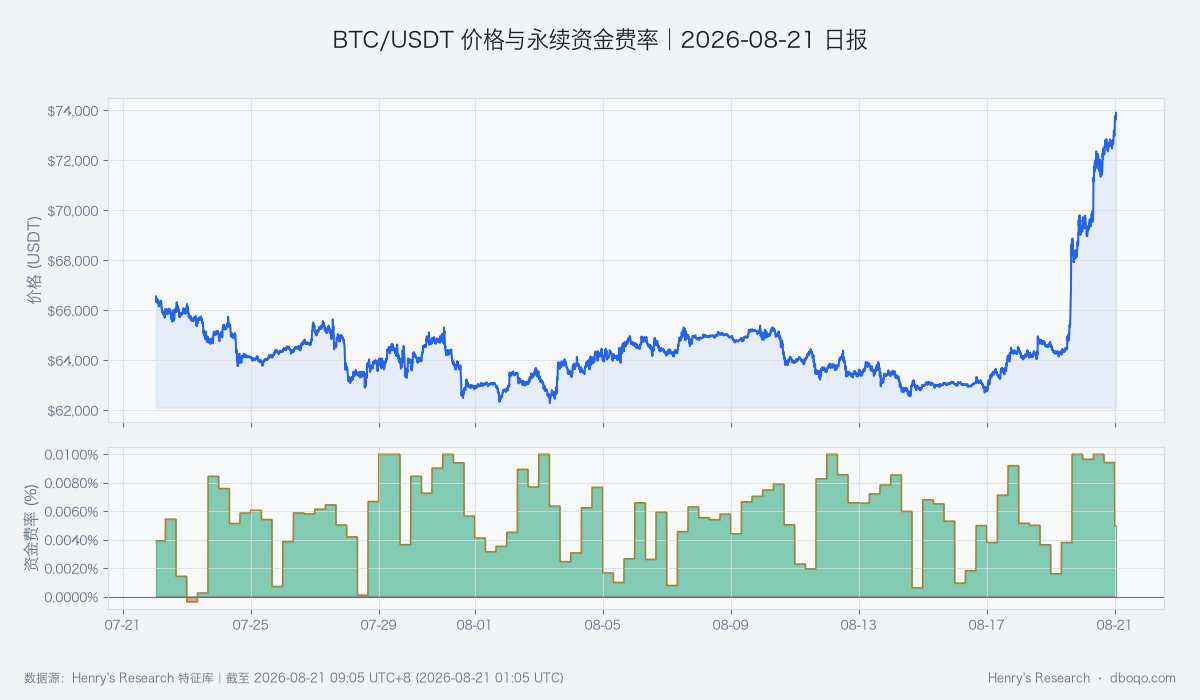
BTC/USDT price and perpetual funding rate over the past 30 days: warmer funding signals stronger long demand but also raises crowding risk.
VI. Cross-Market and Capital Conditions: Warm Capital Temperature Offers Conditional Support
BTC cross-market capital temperature is warm. ETF flows show a net inflow of USD 9.48 hundred-million over the past 5 days, versus a historical mean net outflow of USD 0.66 hundred-million, and only about 18 comparable periods had larger inflows. The 7-day stablecoin supply growth rate is +0.12%, slightly above historical norms, but the 30-day rate remains -0.80%, indicating that improved short-term liquidity has not fully reversed the medium-term contraction. The dollar is unusually weak, while VIX is 14.97 and relatively low, so the macro backdrop currently favors risk appetite. These relationships are conditional: the warm reading could cool quickly if ETF inflows weaken, short-term stablecoin growth turns negative, or the dollar and volatility rebound together.
VII. Combined Signal and Scenario Validation: Bullish Direction Requires Active Trading to Take Over
The combined signal is bullish, consistent with the price gain, trading volume, moving-average expansion, and warm capital temperature. It is not fully aligned with weak active trading flows and higher derivatives risk pricing. The base case for the next 24 hours is therefore consolidation near the highs followed by an attempt to break 73,985.80 USDT, provided active buying improves and funding does not accelerate further. The adverse case is a move below 72,900 USDT back into the prior range while active selling expands. That combination would overturn the bullish view and make a high-volatility pullback more likely.
VIII. Risk Warning: Extreme Gains Amplify Two-Way Volatility and False-Breakout Risk
The current price gain, moving-average expansion, and derivatives risk pricing are all at rare levels. Historical comparisons describe how unusual conditions are; they do not guarantee continuation. High volume may represent new demand, but it may also reflect turnover at elevated prices. With active selling pressure unresolved, a short-term change in liquidity could amplify a pullback. The key observations are absorption above 73,985.80 USDT, defense near 72,900 USDT, the direction of active trading, and whether cross-market capital temperature changes in tandem.
Disclaimer: This report was prepared by dboqo using market data available as of 2026-08-21 09:05 UTC+8. Cryptocurrency markets are highly volatile. This report provides objective analysis of market conditions only and does not constitute investment advice. Investors must assess risks independently and make prudent decisions.