Core Finding and Direction: High-Volatility Turnover Follows a Volume-Backed Surge
Data context: Data are current through 2026-08-22 09:05 UTC+8. The current observation covers the rolling 24 hours ending at the same cutoff and is compared with 180 historical 24-hour samples aligned to that cutoff. Core finding: BTC rose on markedly heavier volume, yet the cumulative slope of active buying minus active selling remained clearly negative. This points to more intense turnover near the highs and shows that sustained active demand has not yet confirmed the rally. Historical comparison: 24-hour trading volume reached 440,122 BTC versus a historical mean of 159,504 BTC; only about 1 of the 180 comparable periods was higher. Price rose 5.61% versus an average gain of 0.07%, with only about 4 comparable periods higher. Both readings are unusually elevated, meaning this was not a low-volume drift, although it also raises the probability of near-term profit-taking and wider swings. Scope check: All 13 quality checks passed. Units, frequencies, and magnitudes were consistent, with no scope-anomaly candidates, so every selected observation remained eligible for the directional assessment. Directional view: Consolidation. Assessment horizon: The next 24 hours. Confirmation conditions: Price holds the main post-rally trading area, active selling pressure eases, and capital conditions remain warm. Invalidation conditions: A confirmed break above 79,555.50 USDT accompanied by stronger active buying would invalidate the consolidation view in favor of a bullish one; a break below 73,869.60 USDT with heavy selling would shift the risk bearish.
Key Market Data: Extreme Volume Confirms a High-Participation Market
BTC last traded at 78,051.90 USDT, up 5.61% over the past 24 hours, within a 79,555.50 to 73,869.60 USDT range. Volume of 440,122 BTC was far above the historical mean of 159,504 BTC, and only about 1 comparable period was higher. This shows that broad participation accompanied the price advance rather than a small number of trades distorting it. The significance is two-sided: participation can make a breakout more credible, but it also accelerates the transfer of risk between buyers and sellers. The next test is whether price can stabilize in the upper part of the range instead of merely recording another brief spike.
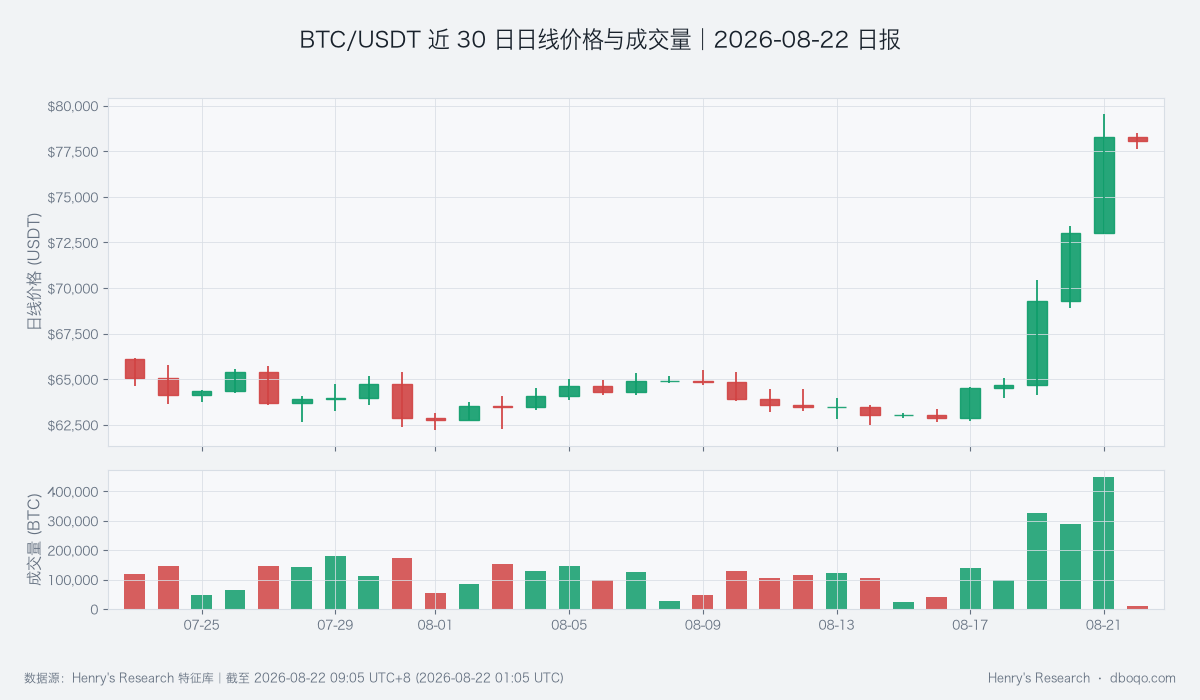
BTC/USDT Daily Price and Volume Over the Past 30 Days
Price Action and Trend: Longer-Term Strength Persists as Intraday Momentum Neutralizes
Price remains well above the 10-day average of 66,567.22 USDT and the 30-day average of 64,960.22 USDT, preserving a meaningful cushion for the medium-term trend. Daily RSI is 86.04; RSI gauges directional momentum, and such a high reading reflects strength while making further upside more dependent on fresh demand. Intraday RSI, meanwhile, has returned to around 49.39, showing that short-term momentum cooled toward balance after the spike. If price holds the upper range and intraday momentum rises again, the trend may extend. If momentum continues to weaken, the longer-term strength is more likely to be absorbed through sideways consolidation.
Price-Volume Structure and Range: Active Selling Challenges One-Way Continuation
The cumulative slope of active buying minus active selling was -320 BTC versus a historical mean of -20 BTC; only about 7 of the 180 comparable periods were equally low or lower. This measure tracks the aggressive side behind completed trades. Its deeply negative reading alongside a price advance means stronger active selling was absorbed near the highs, directly challenging a one-way continuation thesis. Price is currently in the upper half of its 24-hour range but has not broken 79,555.50 USDT again. Only an easing of selling pressure together with a break of the upper boundary would justify treating the heavy volume as trend confirmation.
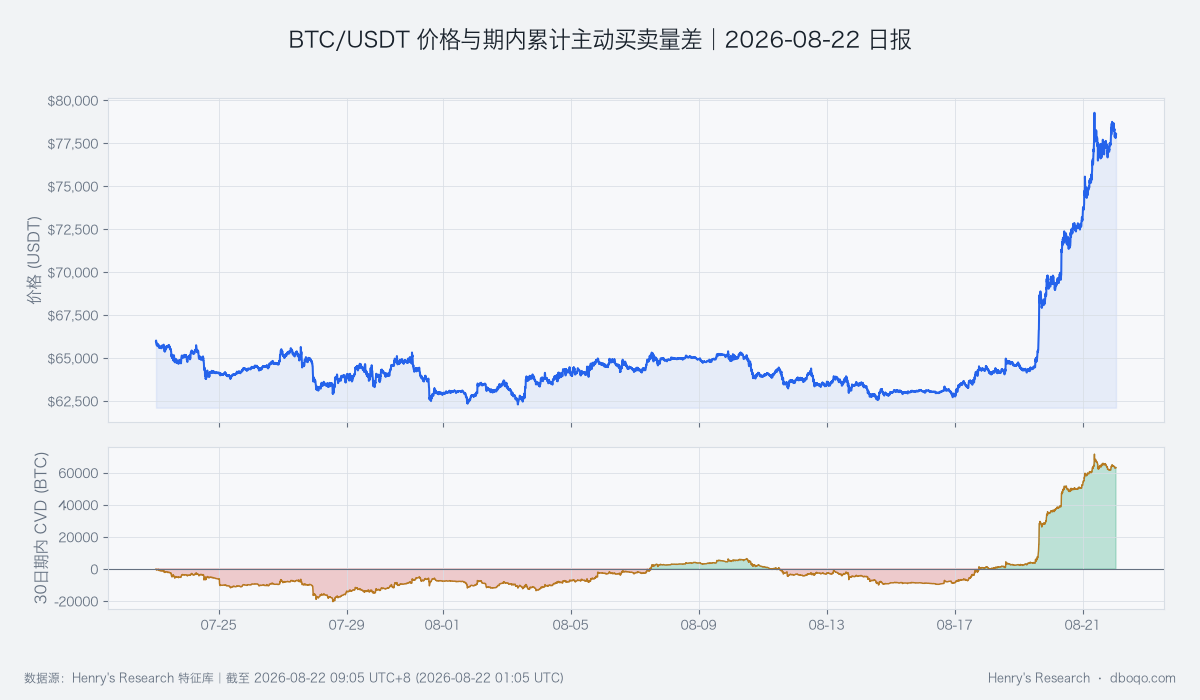
BTC/USDT Price and Cumulative Active Buy-Minus-Sell Volume Over the Past 30 Days
Derivatives Anomalies: Risk Pricing Rises Without Clear Directional Confirmation
Realized volatility over 48 periods was 0.25% versus a historical mean of 0.11%; only about 2 of the 180 comparable periods was higher, showing that actual price movement has become unusually large. The gap between implied and realized volatility was 11.35 versus a historical mean of -0.96, with only about 1 comparable period higher. This gap measures the option premium over recent realized movement and indicates that the market is still paying more for protection against further large swings. The futures basis was -0.03%. Although this is unusually high relative to history, it remains negative, so the derivatives market has not delivered clear one-way bullish confirmation. The next questions are whether the volatility premium eases and whether the basis can turn positive and remain there.
Cross-Market and Capital Conditions: Warm Capital Conditions Cushion High-Level Turnover
The BTC cross-market capital pulse is warm. ETF flows recorded a net inflow of 16.1 hundred million US dollars over the latest 5 days, compared with a historical mean net outflow of 0.56 hundred million US dollars; only about 9 of the 180 comparable periods were higher. Stablecoin supply growth over 7 days was 0.34%, higher than roughly 74% of comparable periods. Together with a softer dollar and market volatility in its normal range, these readings create a conditionally supportive capital backdrop. This matters because it can cushion active selling pressure, but it cannot by itself prove that price must keep rising. A reversal in ETF flows or slower stablecoin growth would materially weaken that cushion.
Composite Signal and Scenario Validation: Bearish Signal Contests Warm Capital Conditions
The composite signal is bearish, aligning with active selling pressure and the negative basis but conflicting with the strong price gain, unusual volume, and warm capital pulse. The combined conclusion therefore remains consolidation. The base case is high-level turnover between 73,869.60 and 79,555.50 USDT while the market waits for active buying to confirm. The upside case requires a break above the upper boundary, stronger active buying minus active selling, and no deterioration in capital conditions. The downside case would be triggered by a break below the lower boundary with heavy selling. Price and transaction conditions aligning in either direction would invalidate the current consolidation view.
Risk Notice
The price gain, trading volume, and realized volatility are all in historically unusual territory, making abrupt rises or declines more likely than normal over a short horizon. Cross-market capital indicators, options pricing, and correlations describe conditions rather than deterministic causality. Macro news, liquidity shifts, and trading-platform disruptions could quickly invalidate the stated range. The priority is to monitor whether the range boundaries, active buy-sell balance, and capital pulse confirm one another instead of extrapolating from any single indicator.
Disclaimer: This report was prepared by dboqo based on market data available through 2026-08-22 09:05 UTC+8. Cryptocurrency markets are highly volatile. This report provides an objective analysis of market conditions only and does not constitute investment advice. Investors must assess risks independently and make prudent decisions.