Core Finding and Direction: Strong ETF Inflows Offset Derivatives Crowding
Data context: Data are current through 2026/8/23 at 09:05 (UTC+8). The current observation covers the preceding 24 hours at the same cutoff, while the historical comparison uses 180 comparable 24-hour samples aligned to that cutoff. Core finding: Net ETF inflows over the past 5 days reached USD 19.28 billion, providing much stronger support than usual. At the same time, funding, the futures-spot basis, and option-volatility pricing all stand at unusually elevated levels. Fresh capital is still cushioning the market, but the cost of chasing gains and sensitivity to drawdowns have also risen. Historical comparison: The historical average for 5-day ETF flows is a net outflow of USD 0.45 billion, and only about 7 of the 180 comparable periods were higher than the current reading. By contrast, funding is +0.010000%, versus a historical average of just +0.001999%, with no comparable period higher than the current level. The former supports improving demand; the latter says bullish exposure has become materially more expensive. Scope review: All 13 data-quality checks passed. Units, frequency, and scale were consistent, with no suspected scope anomalies, so no evidence was excluded from the directional assessment. Directional view: Bullish, but not unconditionally so. Capital-flow evidence agrees with the composite signal, while the price pullback and derivatives crowding are the main counterarguments. Horizon: The next 24 hours. Confirmation conditions: Price holds near the 24-hour low of 76,510.00 USDT and advances again toward the high of 78,831.80 USDT, while active buying minus active selling remains positive. Invalidation conditions: A decisive break below 76,510.00 USDT, or persistently high funding alongside weakening active buying, would invalidate the bullish view and shift the assessment toward a weaker range.
Key Market Data: The Pullback Has Not Broken the Capital-Support Thesis
BTC last traded at 77,262.30 USDT, down 1.01% over 24 hours, versus an average gain of 0.12% across 180 comparable periods. The current result was lower than roughly 74% of comparable periods and slightly weaker than normal. This shows that price is digesting profit-taking after a strong advance; importantly, the pullback has not yet broken the 76,510.00 USDT low. Volume was 122,609 BTC, below the historical average of 161,365 BTC and lower than roughly 67% of comparable periods. Selling was therefore not accompanied by unusually heavy participation, making the move look more like high-level consolidation than a confirmed trend reversal. The next test is whether volume expands during further weakness: a high-volume break below the low would weaken the capital-support thesis, while a low-volume hold followed by a return toward 78,831.80 USDT would leave demand with an opportunity to regain control.
Price Action and Trend: The Broader Trend Is Strong, but the Short Term Needs Confirmation
Price remains well above the 10-day average of 67,930.20 USDT and the 30-day average of 65,360.72 USDT, so the broader trend foundation is intact. RSI is 56.84; this gauge measures short-term upside and downside momentum. The current reading exceeds the historical average of 50.30 and is higher than roughly 71% of comparable periods, indicating positive momentum without creating a requirement to chase. Together with the 24-hour price pullback, this reveals a split between trend and near-term rhythm: the medium-term structure favors watching demand on weakness, while the short term must reclaim the high to confirm continuation. If price stays above both averages and RSI remains above its neutral line over the coming day, the bullish evidence remains valid. If price moves quickly toward 76,510.00 USDT while momentum falls below neutral, drawdown risk should take priority.
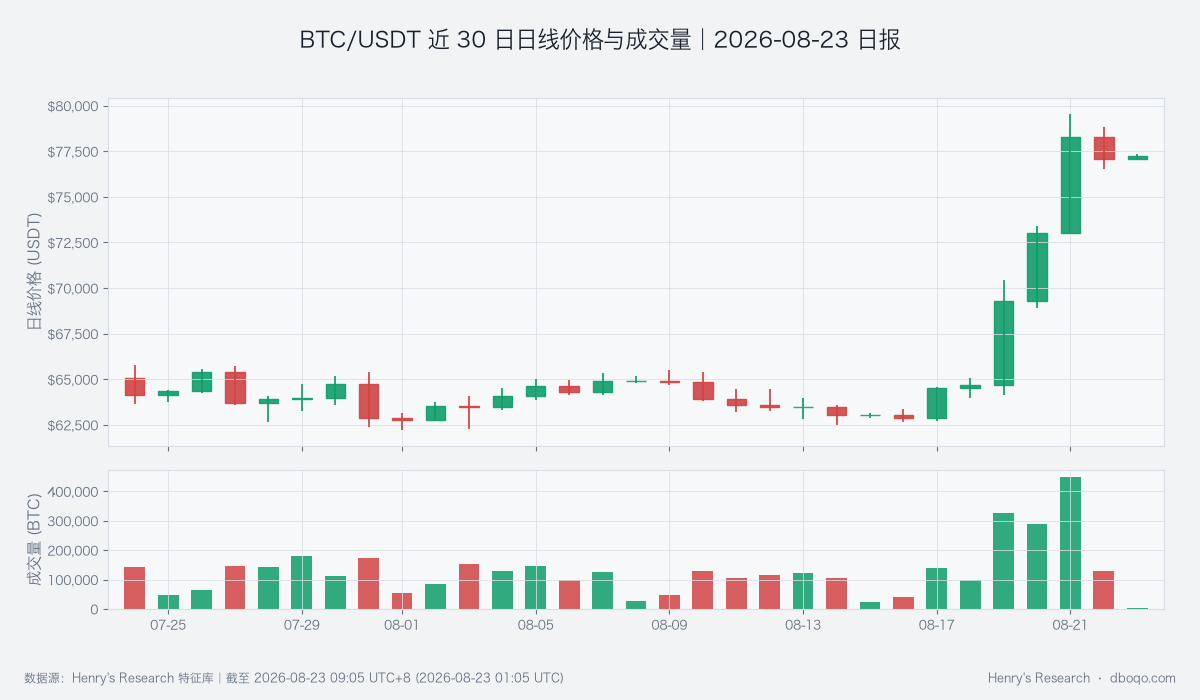
BTC/USDT daily price and volume over the past 30 days; used to assess whether the high-level pullback is accompanied by unusually heavy volume.
Price-Volume Structure and Range: Active Buying Improves, but Overall Participation Is Insufficient
The cumulative active buy-sell slope is +53 BTC, versus a historical average of -22 BTC, and is higher than roughly 68% of comparable periods. This shows that active buying improved relative to active selling during the observation window, directly supporting the transmission of capital inflows into trading demand. However, total volume remains about 38,756 BTC below its historical average, meaning the improvement in buyers still lacks broad participation. Price is now near the middle of the 24-hour range between 76,510.00 and 78,831.80 USDT. The key next test is not a single rebound, but whether active buying remains positive as price approaches 78,831.80 USDT. If volume rises at the same time, a breakout becomes more credible; if price tests the upper boundary while active buying turns negative, that would directly contradict the bullish thesis.
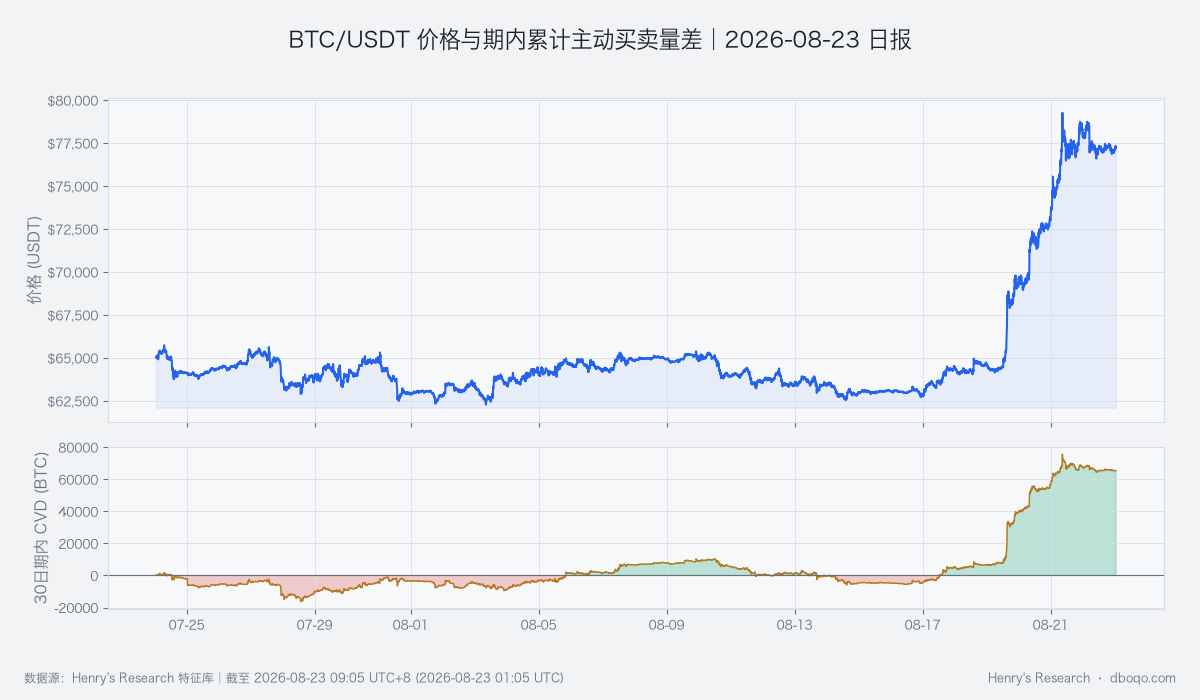
BTC/USDT price and cumulative active buying minus active selling over the past 30 days; used to verify whether price gains have genuine buyer participation.
Derivatives Anomalies: Higher Trading Costs Limit the Room to Chase
Derivatives provide the clearest risk boundary in this report. Funding rose to +0.010000%, well above its historical average of +0.001999%. The futures-spot basis is near -0.00%, versus a historical average of -0.05%; both readings are at the top end of the 180 comparable periods. Basis tracks futures pricing relative to spot. Its move toward zero shows that the earlier discount has been repaired quickly, but it also means the cheap valuation buffer has diminished. The implied-realized volatility spread is +9.74, versus a historical average of -0.82, with only about 5 comparable periods higher. This spread measures the option premium over volatility that has actually occurred; its unusual height shows that the market is paying more for future movement. These signals do not overturn capital support, but they worsen the risk-reward of chasing gains. If funding stays high while price repeatedly fails to break out, crowded exposure could amplify a pullback.
Cross-Market and Capital Conditions: Warm Capital Provides Conditional Support
The BTC cross-market capital pulse is warm. Net ETF inflows over the past 5 days were USD 19.28 billion, with only about 7 comparable periods higher. Stablecoin supply grew 0.68% over 7 days, versus a historical average decline of 0.03%, and was higher than roughly 86% of comparable periods, pointing to an improvement in short-term liquidity. The dollar stands at an unusually low level relative to its own norm, while market-volatility pressure represented by VIX is near the historical midpoint. This combination usually eases external constraints on high-volatility assets. However, stablecoin supply over 30 days is still down 0.65%, showing that the short-term improvement has not yet become a durable expansion. These factors must remain conditional: sustained ETF inflows and a soft dollar would keep supporting the bullish view, while weaker inflows or rising macro volatility would cool the capital backdrop quickly.
Composite Signal and Scenario Validation: Bullish Consensus Awaits Price-Volume Confirmation
The composite signal is bullish and broadly agrees with strong ETF inflows, improving short-term stablecoin supply, a softer dollar, and positive active buying. It does not fully agree with the 24-hour price decline, below-average total volume, or crowded derivatives pricing. The base case is that price completes its consolidation between 76,510.00 and 78,831.80 USDT before testing higher, provided active buying stays positive and volume improves. The stronger case is a break above 78,831.80 USDT with supporting volume, which would make it more likely that capital support translates into price continuation. The adverse case is a break below 76,510.00 USDT or stronger active selling while funding remains high. Either development would overturn the current bullish view, and the next 24 hours should then be assessed as a weaker range.
Risk Notice
The largest current risk is not an immediate deterioration in capital conditions, but a lack of alignment among capital flow, price, and derivatives pricing. ETF flows and short-term liquidity are warm, yet price is still pulling back and trading costs are unusually high. Major macro news, a sudden liquidity shift, or concentrated risk reduction in derivatives could quickly invalidate the 76,510.00 to 78,831.80 USDT range. The assessment should follow synchronized changes in price, volume, and active buying rather than treating a single capital-flow indicator as proof of a certain advance.
Disclaimer: This report was prepared by dboqo using market data through 2026-08-23 09:05 UTC+8. Cryptocurrency markets are highly volatile. This report is an objective analysis of market conditions only and does not constitute investment advice. Investors must assess risks independently and make prudent decisions.