One. Core Finding and Direction: Stronger Momentum Still Lacks Capital and Broad-Volume Confirmation
Data context: As of 2026-08-31 08:55 UTC+8, the current rolling 24-hour window is compared with up to 180 historical 24-hour windows aligned to the same cutoff. All statistics use consistent units, frequencies, and aggregation methods.
Core finding: The MACD histogram rose to +58.21 USDT, showing that short-term downside momentum has clearly repaired. Yet ETF capital is still flowing out, funding is elevated, and total 24-hour trading volume remains below its historical norm. The key question is not whether momentum has strengthened, but whether that strength can attract broader spot demand and turn into a sustained breakout.
Historical comparison: The historical mean of the MACD histogram is only +1.38 USDT, and just about 2 of 180 comparable periods were higher than the current reading. This makes the momentum improvement strong enough to argue against simply extrapolating weakness. However, price still fell 0.31% over the latest 24 hours versus a historical mean gain of 0.09%, while price itself remains within a normal historical range. Momentum is therefore leading price confirmation. The next test is whether price can regain a foothold near the short-term moving average at 78,341.06 USDT.
Scope check: All 13 data-quality checks passed. No unit, frequency, or magnitude anomalies were found, and there are no scope-anomaly candidates. Every highlighted move is therefore treated as a market development and included in the directional assessment.
Directional view: Range-bound. Momentum repair provides a cushion, but capital and broad-volume evidence are insufficient to confirm a one-way advance. Bearish votes slightly outnumber bullish ones without forming an overwhelming consensus.
Assessment horizon: The next 24 hours. Conditions for the view to hold: Price oscillates around the short-term moving average, MACD stays positive, ETF outflows stop expanding, and volume gradually improves. Invalidation conditions: A volume-backed hold above 79,384.40 USDT would shift the view bullish; a break below 76,947.20 USDT alongside stronger aggressive selling would shift it bearish.
Two. Key Market Data: The Price Pullback Is Limited, but All-Day Participation Is Weak
BTC trades at 77,903.80 USDT, down 0.31% over 24 hours, within a range of 76,947.20 to 79,384.40 USDT. The decline is close to its historical norm, which means the market is not in a disorderly slide. The more important issue is missing confirmation rather than a structure that has already failed. Watch which side of the range breaks decisively; a single touch is not enough to change the view.
Trading volume over 24 hours was 97,036 BTC, below the historical mean of 157,899 BTC and lower than about 79% of comparable periods. Weak total volume means price changes lack broad participation, making momentum signals more prone to reversal. If price rises while total volume stays subdued, confidence in the breakout will remain limited.
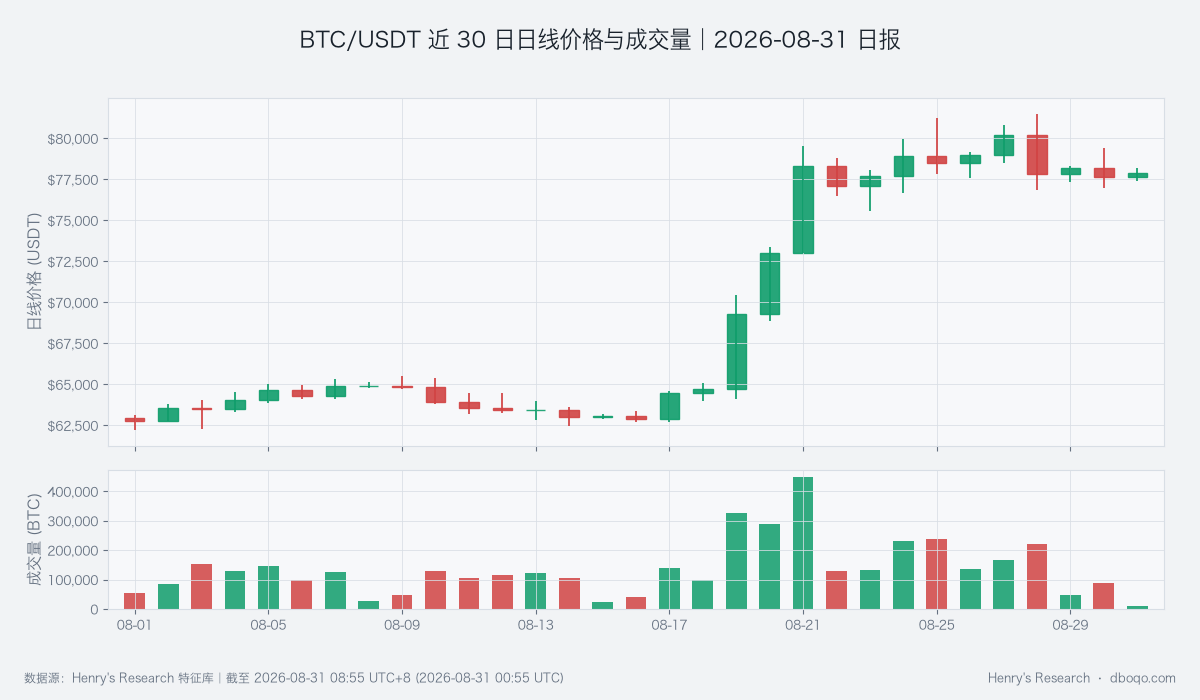
BTC/USDT price and volume over the past 30 days: stronger short-term momentum still needs all-day volume support
Three. Price Action and Trend: Short-Term Momentum Leads, while the Daily Position Still Needs Confirmation
The MACD histogram tracks the acceleration of a trend. At +58.21 USDT, it stands far above its historical mean of +1.38 USDT, with only about 2 comparable periods higher, so the short-term repair is more than ordinary noise. At the same time, the daily close remains slightly below the 10-day moving average of 78,341.06 USDT but well above the 30-day moving average of 69,193.85 USDT. Medium-term support remains intact, while a short-term breakout is unconfirmed. The next question is whether the shorter average can turn from resistance into support, rather than whether momentum can rise further in isolation.
Four. Price-Volume Structure and Range: Local Activity Is Rising, but Broad Volume Is Still Missing
The relative volume measure is 1.11 versus a historical mean of 1.03, with only about 3 of 180 comparable periods higher. It shows that activity in the latest local intervals accelerated sharply, but that does not conflict with low all-day volume of 97,036 BTC: the former captures short bursts of activity, while the latter shows that participation across the full day remains narrow. This distinction matters because a local burst can prompt a rapid test without proving that durable trend capital has arrived. The price-range amplitude is 2.38% versus a historical mean of 1.20%. Only if local activity broadens and lifts total volume will a durable break above the range become more likely.
Five. Derivatives: Warmer Funding Constrains the Room for Chasing Gains
Funding measures the cost paid between the long and short sides of perpetual contracts. Its 24-hour average is +0.008405%, above the historical mean of +0.002395%, with only about 10 of 180 comparable periods higher. Warmer positive funding indicates stronger willingness to pay for long exposure; when spot volume is weak, that increases crowding and pullback risk. It therefore argues against immediately following the MACD improvement. Watch whether funding can ease while price remains stable. If funding keeps rising but price cannot clear the top of the range, range-bound weakness will become more likely.
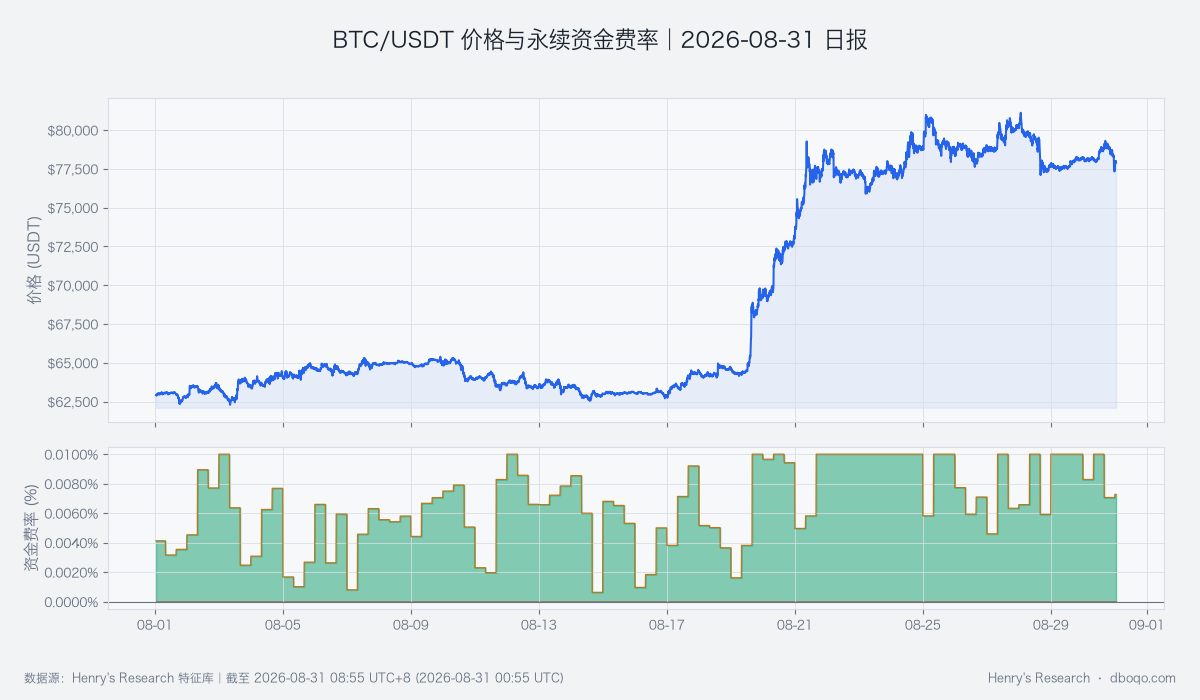
BTC/USDT price and perpetual funding over the past 30 days: warmer funding has not yet produced a price breakout
Six. Cross-Market and Capital Flows: Stablecoin Improvement Offsets ETF Outflows, Keeping the Temperature Neutral
The BTC cross-market capital temperature is neutral. ETFs recorded a net outflow of USD 1.31 hundred-million over the past 5 days versus a historical mean net outflow of USD 0.08 hundred-million; flow strength was as low or lower in only about 12 of 180 comparable periods, pointing to weak demand through traditional channels. In contrast, 7-day stablecoin supply grew 0.28% versus a historical mean decline of 0.02%, above about 72% of comparable periods, indicating an improvement in capital available within crypto markets. Dollar and VIX factors do not point consistently toward either pressure or support, so ETF outflows cannot be read as deterministic downside. Watch whether better stablecoin supply translates into spot volume and offsets the ETF drag.
BTC's correlation with US equities is -0.210 versus a historical mean of +0.102, with only about 7 of 180 comparable periods equally low or lower. This inverse relationship shows that BTC has recently been driven more by its own capital structure, reducing the explanatory power of US equity direction. That matters because an improvement in external risk appetite may not automatically produce a breakout. Cross-market evidence would become clearly supportive only if correlation normalizes while the capital temperature also rises.
Seven. Combined Signal and Scenario Test: A Range Consensus Awaits a Choice from Volume and Capital
The combined signal is range-bound and agrees with the price-volume evidence. The sharp MACD improvement supports a repair, and stronger local activity supports attempts to rebound. However, weak all-day volume, ETF outflows, and elevated funding argue against an immediate one-way advance. The base case is continued consolidation between 76,947.20 and 79,384.40 USDT. A return of total volume toward its historical mean, narrowing ETF outflows, and a sustained hold above the upper boundary would invalidate the current view in favor of a bullish one. Stronger aggressive selling and a break below the lower boundary would invalidate it in favor of a bearish one.
Eight. Risk Warning: High Funding and Low Total Volume Can Amplify False Breakouts
The main risk over the next 24 hours is mistaking local activity for broad capital confirmation. When funding is elevated, a failed push higher can trigger a faster reversal. The unusually low correlation also makes conventional cross-market readings less reliable for now. The observation order should be the range break, all-day volume, ETF flows, and funding changes; no single indicator is sufficient to confirm the trend.
Disclaimer: This report was prepared by dboqo using market data available as of 2026-08-31 08:55 UTC+8. Cryptocurrency markets are highly volatile. This report provides only an objective analysis of market conditions and does not constitute investment advice. Investors must assess risks independently and make prudent decisions.