Core Finding and Direction: A Low-Volume Rebound Lacks Confirmation as Hotter Derivatives Raise Pullback Risk
Data Basis: As of 2026-08-30 09:10 UTC+8, this report examines the latest 24 hours and compares them with up to 180 historical 24-hour windows aligned to the same cutoff time. The current and historical samples use consistent units, frequencies, and aggregation methods.
Core Finding: BTC edged higher, but trading volume fell into the extreme low end of comparable history and active buying did not strengthen with price. At the same time, the funding rate rose to a high level, showing a marked increase in perpetual-contract demand from longs. Higher prices, thin spot-market participation, and hotter derivatives together make this rebound look like a fragile repair rather than a confirmed new upswing.
Historical Comparison: Trading volume over the latest 24 hours was 46,565 BTC, versus a historical average of 159,145 BTC; among 180 comparable periods, only about 4 were as low or lower. The funding rate was +0.009911%, versus a historical average of +0.002335%, with only about 2 comparable periods higher. Volume far below normal alongside contract costs far above normal means the advance has a thin spot foundation. The next test is whether volume can recover enough to support elevated derivatives demand.
Scope Review: All 13 quality checks passed. No unit, frequency, or magnitude anomalies were found, and there are no scope-anomaly candidates that must be excluded from the directional assessment. The sharp change in BTC's relationship with US equities is treated as a market anomaly, not a data error.
Directional View: Bearish. Price has not established price-volume confirmation, short-term momentum is weak, and the composite signal also points to downside risk. ETF inflows and stablecoin expansion provide a cushion, but for now they are more likely to slow a decline than reverse the base case.
Assessment Horizon: The next 24 hours. Conditions for the View: Price fails to hold effectively above 78,315 USDT, volume remains materially below normal, and active net buying stays weak. Invalidation Conditions: Price breaks above 78,315 USDT on stronger volume, active buying turns positive, and the funding rate cools while price remains firm.
Key Market Data: A Modest Price Gain Masks a Sharp Contraction in Volume
BTC last traded at 78,047.60 USDT, up +0.56% over the latest 24 hours, within a 77,353.00–78,314.90 USDT range. The gain was higher than about 64% of comparable periods, only modestly above normal. The more important figure is volume of 46,565 BTC, roughly one-third of the historical average of 159,145 BTC. Price rose without sufficient turnover, indicating that buyers have not formed a broad consensus. If price tests the range high without improving volume, profit-taking could interrupt the rebound.
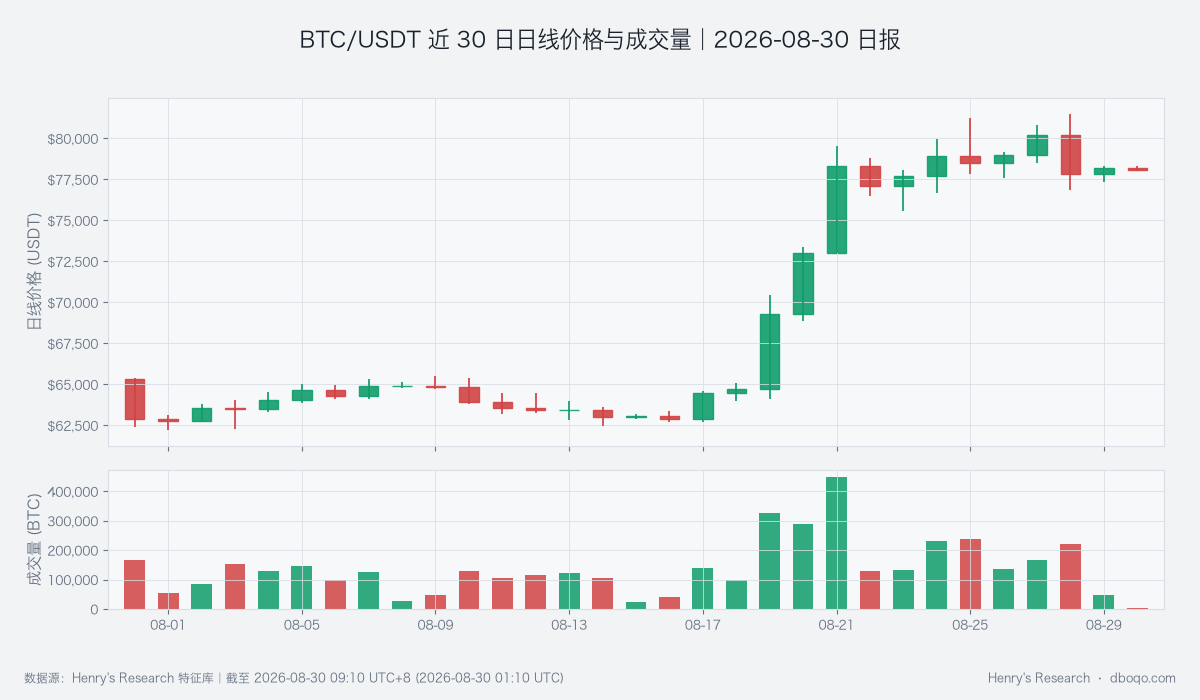
BTC/USDT Daily Price and Trading Volume Over the Past 30 Days
Price Action and Trend: Long-Term Support Remains, but the Short-Term Repair Is Incomplete
Price is slightly above the 10-day moving average at 77,877.47 USDT and well above the 30-day moving average at 68,701.36 USDT, so the medium-term rising structure has not broken. However, the short-term momentum reading is -16.17 USDT, below its historical average of +1.69 USDT and lower than about 78% of comparable periods. Long-term support and short-term weakness coexist: moving averages can buffer downside, but rebound persistence still needs proof. Watch whether the 10-day average holds and whether short-term momentum turns positive again.
Price-Volume Structure and Price Range: Weak Active Buying Keeps the Lower Boundary in Focus
The cumulative slope of active buying minus active selling was -39 BTC, versus a historical average of -21 BTC. Although still within a normal range, it shows a slight seller advantage. Active net-buying strength was -0.48, versus a historical average of +0.08; only about 18 of 180 comparable periods were as low or lower. Price was near 8% of its recent observation range, versus a historical average near 51%, showing that the rebound remains close to the lower part of the range. If active buying does not turn positive, the low near 77,353 USDT will remain under pressure. If buying improves with higher volume, the lower structure could become effective support.
Derivatives Anomaly: Hot Funding and Contract-Participation Contraction Weaken Confirmation
The funding rate is the periodic cost exchanged between long and short holders of perpetual contracts. Its current-period average was +0.009911%, materially above the historical average of +0.002335%, with only about 2 comparable periods higher, indicating hot long demand. Meanwhile, contract participation fell -2.56% over the latest 24 hours, compared with a historical average increase of +0.24%, placing it below about 88% of comparable periods. The average spot-perpetual basis remained -0.04%, meaning contracts did not establish a durable premium to spot. High cost, low participation, and a negative basis suggest that buying interest may be concentrated rather than broad. A healthier confirmation would require funding to ease while contract participation and price rise together.
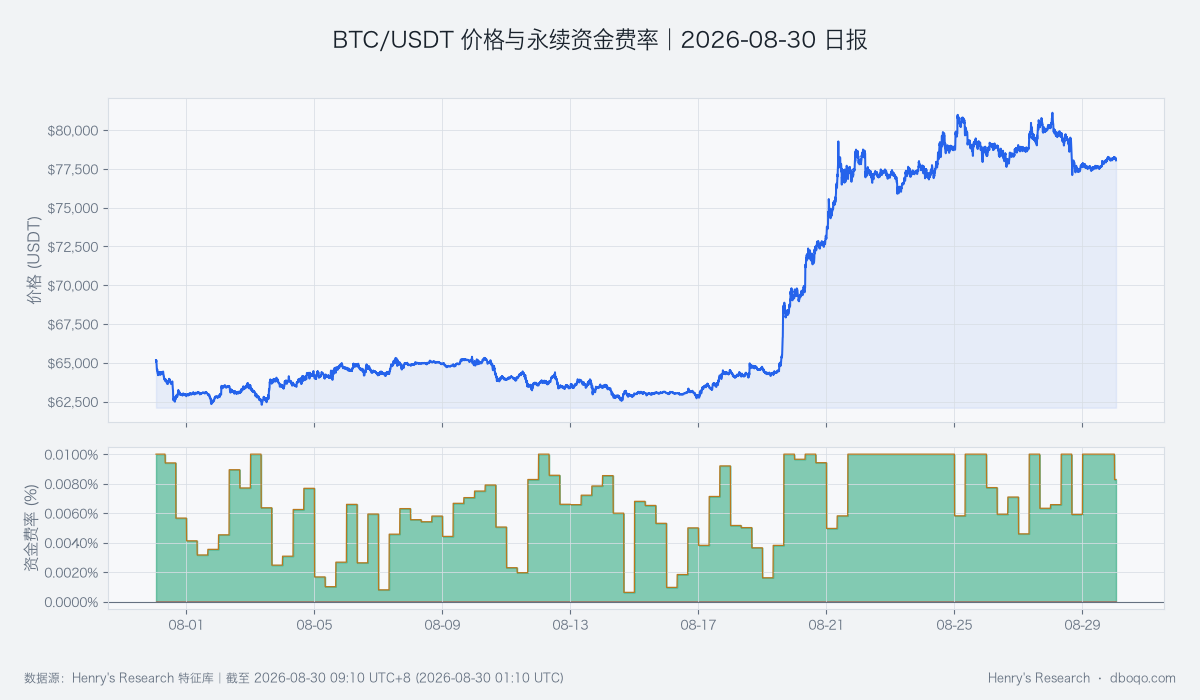
BTC/USDT Price and Perpetual Funding Rate Over the Past 30 Days
Cross-Market and Capital Conditions: Neutral Capital Temperature Provides No One-Way Impulse
BTC Cross-Market Capital Temperature is neutral. ETF flows showed a net inflow of USD 3.85 hundred million over the latest 5 days, versus a historical average net outflow of USD 0.06 hundred million, higher than about 66% of comparable periods. Stablecoin supply grew +0.31% over 7 days, higher than about 72% of comparable periods, indicating some improvement in sidelined liquidity. The U.S. dollar index at 99.17 and VIX at 14.47 also describe a relatively benign macro backdrop. However, BTC's correlation with US equities fell to -0.208, versus a historical average of +0.119; among 180 comparable periods, only about 1 was as low or lower. This break means traditional risk appetite cannot directly explain BTC for now. Capital conditions can cushion price, but they cannot replace price-volume confirmation.
Composite Signal and Scenario Test: The Bearish Signal Agrees with Price-Volume Evidence, While Better Capital Conditions Are the Counterargument
The composite signal is bearish, consistent with extremely low trading volume, weak active net buying, and insufficient short-term momentum. ETF inflows, stablecoin expansion, and support from long-term moving averages are the counterevidence. The base case is for price to remain weak within the 77,353–78,315 USDT area and test demand near the lower boundary. A break below the lower boundary with stronger active selling would reinforce the bearish view. A high-volume break above the upper boundary, positive active buying, and cooler derivatives demand would invalidate it and shift the market toward a more credible upside repair.
Risk Notice: Low Volume and Cross-Market Misalignment May Amplify Short-Term Swings
Thin trading during weekends or other low-activity periods reduces the reliability of price signals, allowing relatively small flows to cause large moves. BTC's relationship with US equities is also far from historical norms, making cross-market hedging cues less reliable for now. A high funding rate could accelerate contract adjustments if price falls. The key is to watch volume, active buying, range boundaries, and funding together rather than infer direction from any single indicator.
Disclaimer: This report was prepared by dboqo based on market data available as of 2026-08-30 09:10 UTC+8. Cryptocurrency markets are highly volatile. This report is an objective analysis of market conditions only and does not constitute investment advice. Investors should assess risks independently and make prudent decisions.