Core Finding and Direction: A Low-Volume Rally Meets Hotter Funding, Leaving the Short Term in Validation Mode
Data context: Data are current through 2026-09-01 08:55 UTC+8. The current observation covers the preceding 24 hours, while the historical comparison uses 180 periods aligned to the same cutoff time. Core finding: BTC rose 0.92% and the short-term moving-average spread widened to +113.65 USDT, but relative volume was only 0.99 while the average funding rate climbed to +0.009141%. This means price and trend now support a rebound, yet trading activity has not expanded with it, while optimism in perpetual contracts is running ahead of spot volume. Historical comparison: Relative volume has a historical mean of 1.03, and only about 9 of the 180 comparable periods were as low or lower; funding has a historical mean of +0.002438%, and only about 7 periods were higher. The combination of low volume and high funding shows that the foundation for chasing the rally remains fragile, making it the key tension in this report. Scope review: All 13 quality checks passed, with consistent units, frequencies, and magnitudes; there are no measurement-scope anomaly candidates that need to be excluded from the directional view. Directional view: Range-bound; the one-day rise should not be extrapolated directly into a breakout. Assessment horizon: The next 24 hours. Confirmation conditions: Price holds near the 10-day average at 78,365.11 USDT, volume recovers, and funding does not rise excessively. Invalidation conditions: A volume-backed hold above 79,228.50 USDT would shift the view bullish; a break below 77,350.70 USDT accompanied by stronger aggressive selling would shift it bearish.
Key Market Data: Price Is Higher, but Aggregate Activity Has Not Endorsed a Breakout
BTC last traded at 78,618.00 USDT, within a 24-hour range of 77,350.70 to 79,228.50 USDT, for a gain of 0.92%. This shows buyers have pushed price back into the upper half of the range, but the intraday high has not been cleared, so the breakout still lacks final confirmation. Turnover over 24 hours was 124,627 BTC, below the historical mean of 157,006 BTC and lower than about 64% of comparable periods. The rise therefore looks more like a recovery driven by limited capital than a trend expansion with broad participation. The next key test is whether volume can return toward its historical mean when price challenges 79,228.50 USDT; if activity stays subdued, the upper range is more likely to remain choppy.
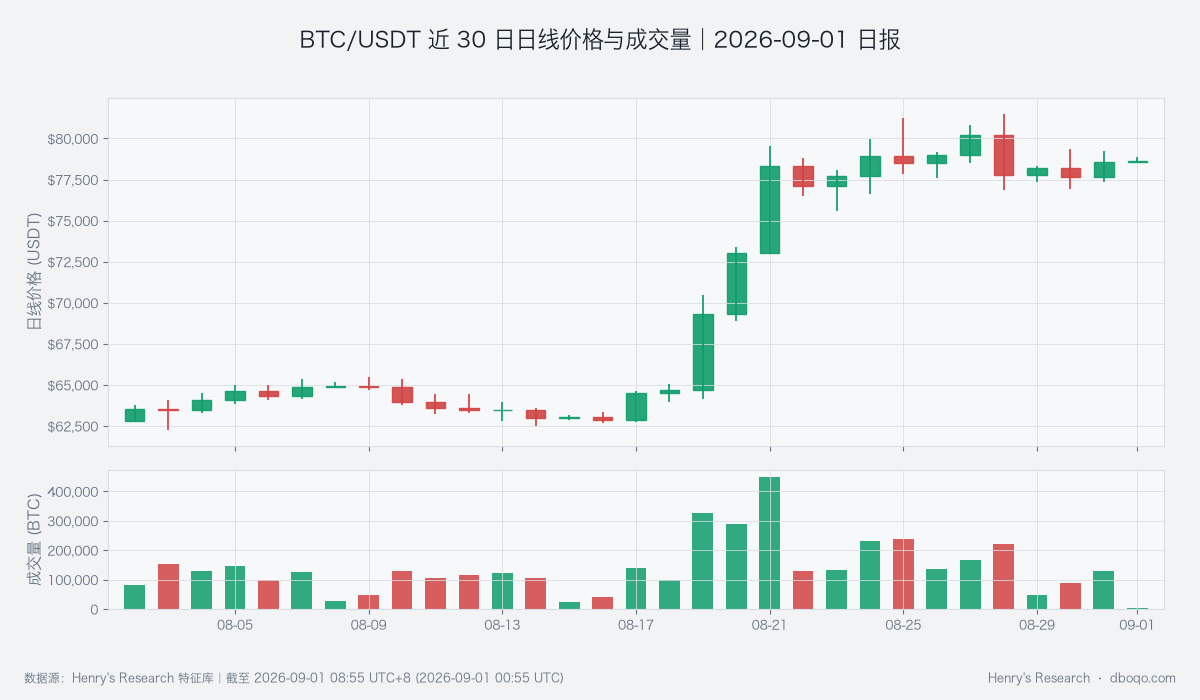
BTC/USDT daily price and volume over the past 30 days; synchronized expansion in price and volume is the key breakout test.
Price Action and Trend: Moving Averages Strengthen, but Short-Term Momentum Has Not Fully Taken Over
The close sits slightly above the 10-day average of 78,365.11 USDT and well above the 30-day average of 69,719.10 USDT. The short-term moving-average spread is +113.65 USDT versus a historical mean of only +8.92 USDT, higher than about 80% of comparable periods. This indicates that the medium- and short-term structure still offers support and that the pullback has not broken the main upward framework. However, intraday RSI is 46.08. RSI measures the balance of upward and downward momentum; its historical mean is 50.57, and the current reading is lower than about 66% of comparable periods, showing that near-term buying momentum has not caught up with the moving-average structure. If RSI reclaims 50 while price remains above the 10-day average, trend support would become more complete; otherwise, the moving-average advantage may amount only to lagging support.
Price-Volume Structure and Range: Aggressive Buying Turns Positive, but Low Volume Caps the Upside
The cumulative slope of aggressive buying minus aggressive selling is +5 BTC versus a historical mean of -16 BTC, shifting from selling pressure to a slight buying bias while remaining within the normal historical range. At the same time, aggressive net-buying strength is -0.35, lower than about 85% of comparable periods. Together, these readings mean local demand has improved but has not developed into sustained and broad aggressive buying. Price is now in the upper half of its 24-hour range: 79,228.50 USDT is the first upside boundary to validate, while 77,350.70 USDT marks the downside risk line. A test of the upper boundary accompanied by stronger aggressive buying would resolve the price-volume conflict; if price rises while aggressive net buying remains weak, the rebound is more likely to stall near the top of the range.
Derivatives Dislocation: Funding Is Hot, while Basis Still Does Not Confirm Optimism
The average funding rate is +0.009141%. Funding measures the cost exchanged between the long and short sides of perpetual contracts; it stands well above the historical mean of +0.002438%, with only about 7 of the 180 comparable periods higher, showing that optimism in perpetuals has become hot. At the same time, average futures basis is -0.04%. Basis tracks the premium or discount of perpetual prices relative to spot, and the current reading remains a slight discount, indicating that hotter contract demand has not translated into a consistent positive premium. This combination matters because higher funding can amplify short-term volatility when a rally lacks spot-market volume. The next test is whether funding can cool without price losing support; if funding keeps rising while basis remains negative, the quality of the rebound will deteriorate further.
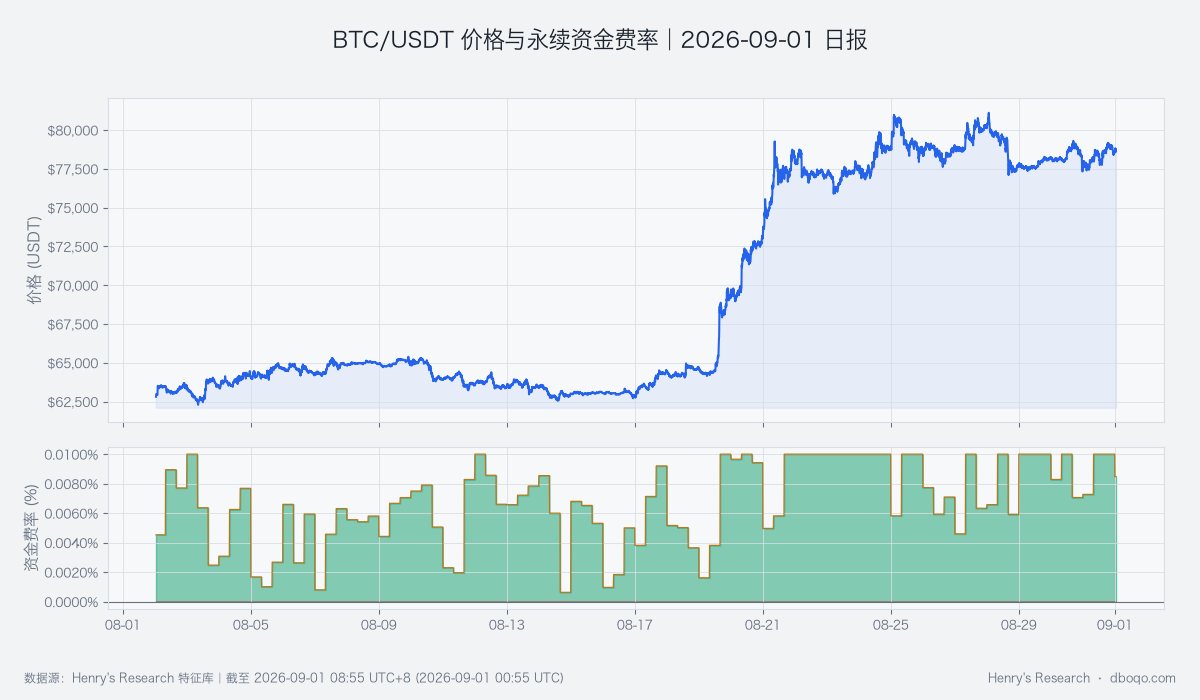
BTC/USDT price and perpetual funding over the past 30 days; watch whether hotter funding receives confirmation from price and volume.
Cross-Market and Capital Flows: Stablecoin Recovery Offsets ETF Outflows, Keeping the Capital Pulse Neutral
The BTC cross-market capital pulse is neutral. ETFs recorded net outflows of 3.63 hundred million US dollars over the past 5 days, versus a historical mean net outflow of 0.12 hundred million US dollars, showing that the traditional capital channel remains cautious. Stablecoin supply growth over 7 days was +0.21%, above its historical mean of -0.02%, while 30-day growth was also +0.79%, indicating some recovery in liquidity available within crypto markets. The dollar index is 99.42 and VIX is 15.07, so macro risk pressure has not increased materially, but these factors are conditional background and cannot by themselves explain BTC moves. BTC's correlation with equities is -0.188 versus a historical mean of +0.099, with only about 8 of the 180 comparable periods as low or lower. This means BTC has recently been driven more by its own capital structure, and equity direction has become a less reliable confirmation tool. The capital pulse would turn warmer only if ETF flows improve while stablecoin growth stays positive.
Composite Signal and Scenario Validation: The View Is Range-Bound, and Any Breakout Must Pass Both Volume and Funding Tests
The composite signal points to a range, broadly consistent with the public market evidence. The moving-average spread and price gain provide bullish support, while low volume, weak aggressive net buying, ETF outflows, and hot funding impose counterweights. The core conflict is not whether price can rise briefly, but whether that rise can gain joint confirmation from spot volume and healthier funding costs. The bullish scenario requires a volume-backed break above 79,228.50 USDT, stronger aggressive buying, and no further material rise in funding. The bearish scenario would be triggered jointly by a break below 77,350.70 USDT, expanding aggressive selling, and continuing ETF outflows. A price move on either side without the other two pieces of evidence would be insufficient to overturn the range-bound view.
Risk Warning
Correlation is currently near a historical low, so the explanatory value of cross-market comparisons may change quickly. Hot funding can also magnify near-term volatility after news shocks. ETF and stablecoin data arrive at different frequencies, making the capital pulse more suitable for trend validation than for pinpointing intraday reversals. Investors should focus on volume around the two boundaries at 79,228.50 and 77,350.70 USDT and retain an adequate risk buffer if volatility expands.
Disclaimer: This report was prepared by dboqo using market data available through 2026-09-01 08:55 UTC+8. Cryptocurrency markets are highly volatile. This report provides objective analysis of market conditions only and does not constitute investment advice. Investors must assess risks independently and make prudent decisions.