One — Core Finding and Direction: A Flat Weekly Close Masks Simultaneous Weakness in Trend and Cross-Market Linkages
Data context: This report covers the complete UTC calendar week from 2026-08-24 00:00 to 2026-08-31 00:00. Data are current through 2026-08-31 07:55 UTC+8, comprising 2,016 5-minute observations and a historical baseline of 104 complete comparable weeks. Core finding: BTC fell only 0.11% over the week, which looks like consolidation, but the 77,634.60 USDT close was well below the weekly high of 81,500.00 USDT. More importantly, BTC's 30-day correlation with U.S. equities dropped to -0.212, while the short-term moving-average spread, MACD momentum and the cumulative slope of aggressive buys minus aggressive sells all weakened. The calm weekly close therefore understates the internal pressure. Historical comparison: BTC's correlation with U.S. equities has a historical mean of +0.169; among 104 comparable weeks, only about 2 were as low or lower. The short-term moving-average spread was -493.95 USDT versus a historical mean of +9.20 USDT, with only about 6 weeks as low or lower. Methodology check: No candidate unit, frequency or magnitude anomalies were detected. The unusually negative correlation is a market anomaly and remains part of the research evidence, but it does not determine direction by itself. Directional view: Bearish. Horizon: The next calendar week. Confirmation conditions: Price fails to regain the 10-day moving average near 77,877.47 USDT, aggressive selling persists, and the capital pulse does not improve materially. Invalidation conditions: Price reclaims 81,500.00 USDT on expanding volume, aggressive buying persists, and medium-term liquidity growth improves in tandem.
The central issue is not how large the decline was, but whether price, trend and order flow confirm one another. Weekly volatility was modest, yet BTC retreated from its high and closed near the lower end of the week's range. That structure means rallies may first encounter overhead supply and short-term moving-average resistance unless fresh capital arrives next week. On the other hand, 5-day ETF flow remained a net inflow of 3.85 hundred-million U.S. dollars, while aggressive net-buy intensity was higher than roughly 87% of comparable weeks. These are genuine counterpoints, so the bearish view is not a one-way forecast; the market can overturn it with a stronger price breakout.
Two — Historical Comparison and Key Anomalies: Extreme Negative Correlation Matters More Than the Muted Weekly Return
The strongest finding this week is that the usual positive linkage with U.S. equities reversed to -0.212, far below its +0.169 historical mean. Among 104 comparable weeks, only about 2 were as low or lower. This means BTC's recent price formation has diverged materially from traditional risk assets: even if the equity backdrop remains stable, one cannot simply infer that BTC will benefit in parallel. Why does it matter? A familiar channel for cross-market hedging and risk appetite has weakened. Next week, the key question is whether this negative correlation is a temporary dislocation or persists alongside BTC-specific selling pressure.
The second important anomaly comes from trend. The short-term moving-average spread of -493.95 USDT and MACD histogram of -58.13 USDT compare with historical means of +9.20 and +1.06 USDT, respectively; each has only about 6 comparable weeks that were equally low or lower. Together they show that weakness is not noise from a single indicator. If both recover before price breaks out, downside pressure would be easing. If they deteriorate further, a flat weekly close is more likely to develop into a directional decline.
Three — Price Action and Trend: Short-Term Momentum Remains Weak After a Failed Rally
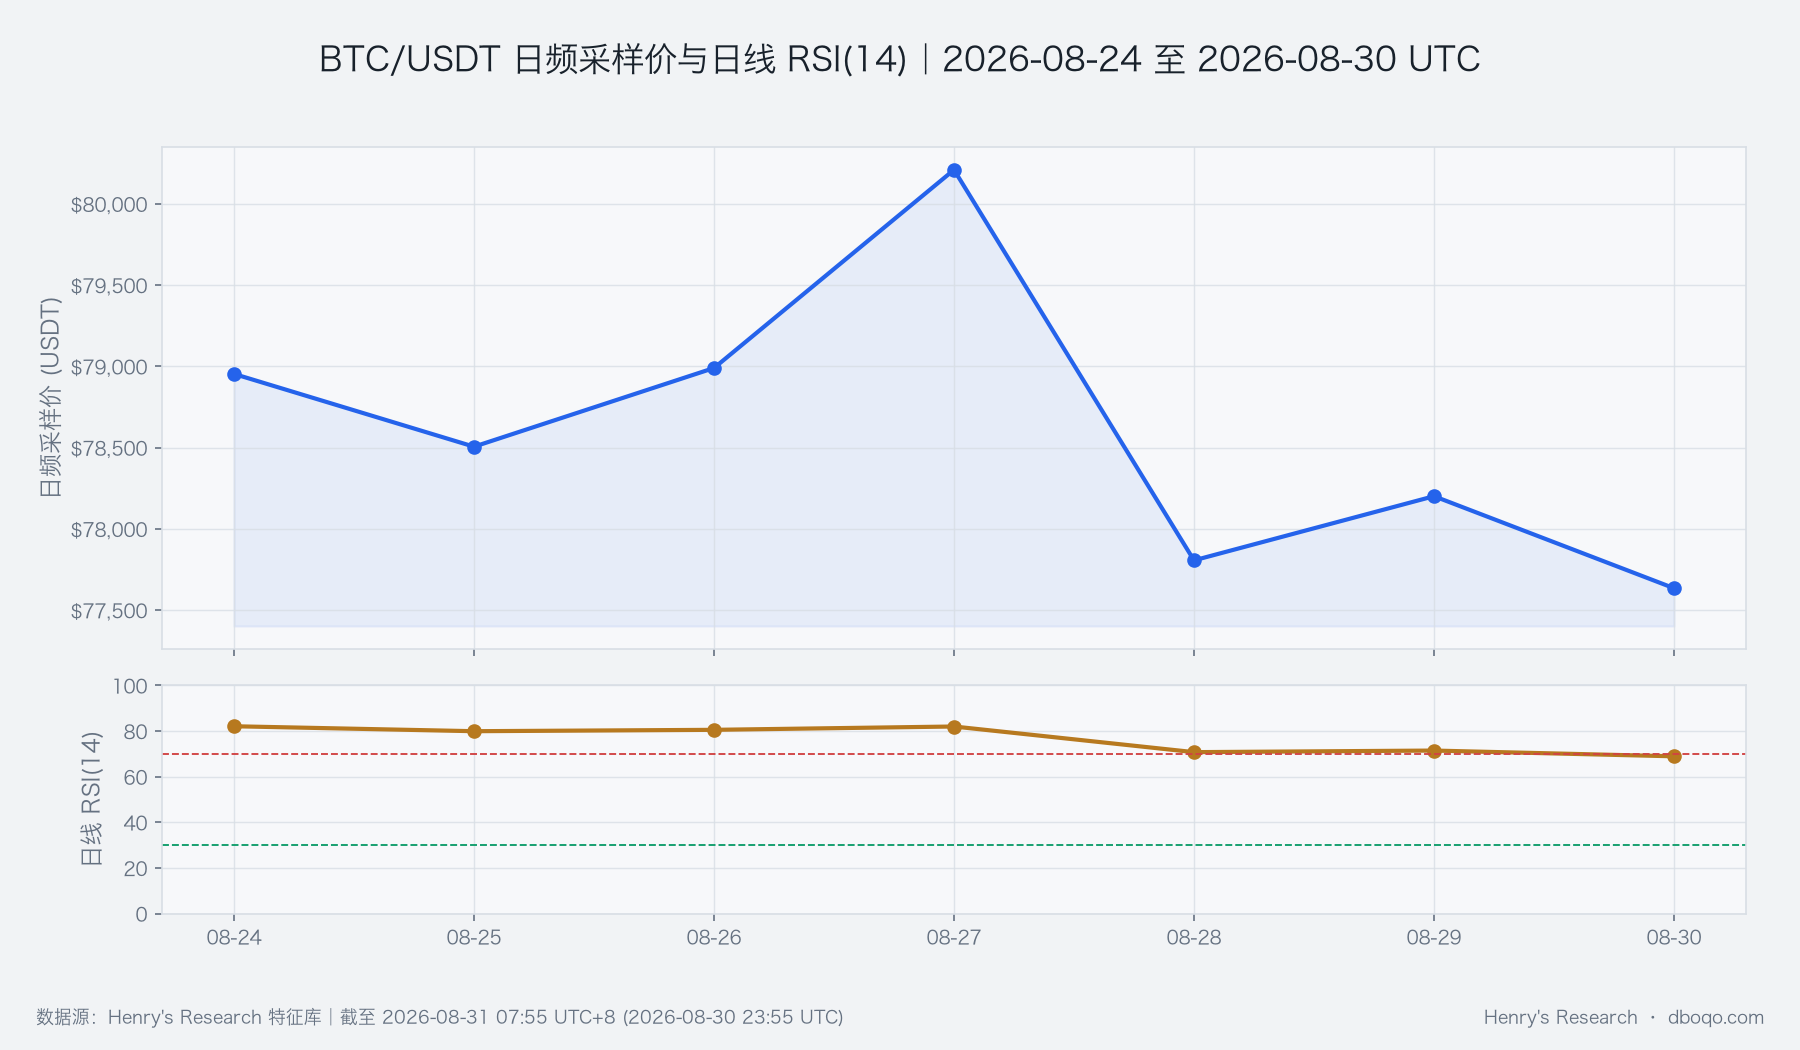
BTC opened the week at 77,719.00 USDT, reached a high of 81,500.00 USDT, fell to a low of 76,649.00 USDT and closed at 77,634.60 USDT. The 0.11% weekly decline is historically ordinary, but the close was about 4.7% below the weekly high, making overhead selling more informative than the headline return. Short-horizon RSI stood at 33.67. RSI measures the balance of recent gains and losses; this reading was below roughly 89% of comparable weeks versus a historical mean of 51.33, showing weak near-term momentum, though a low reading alone does not establish a reversal.
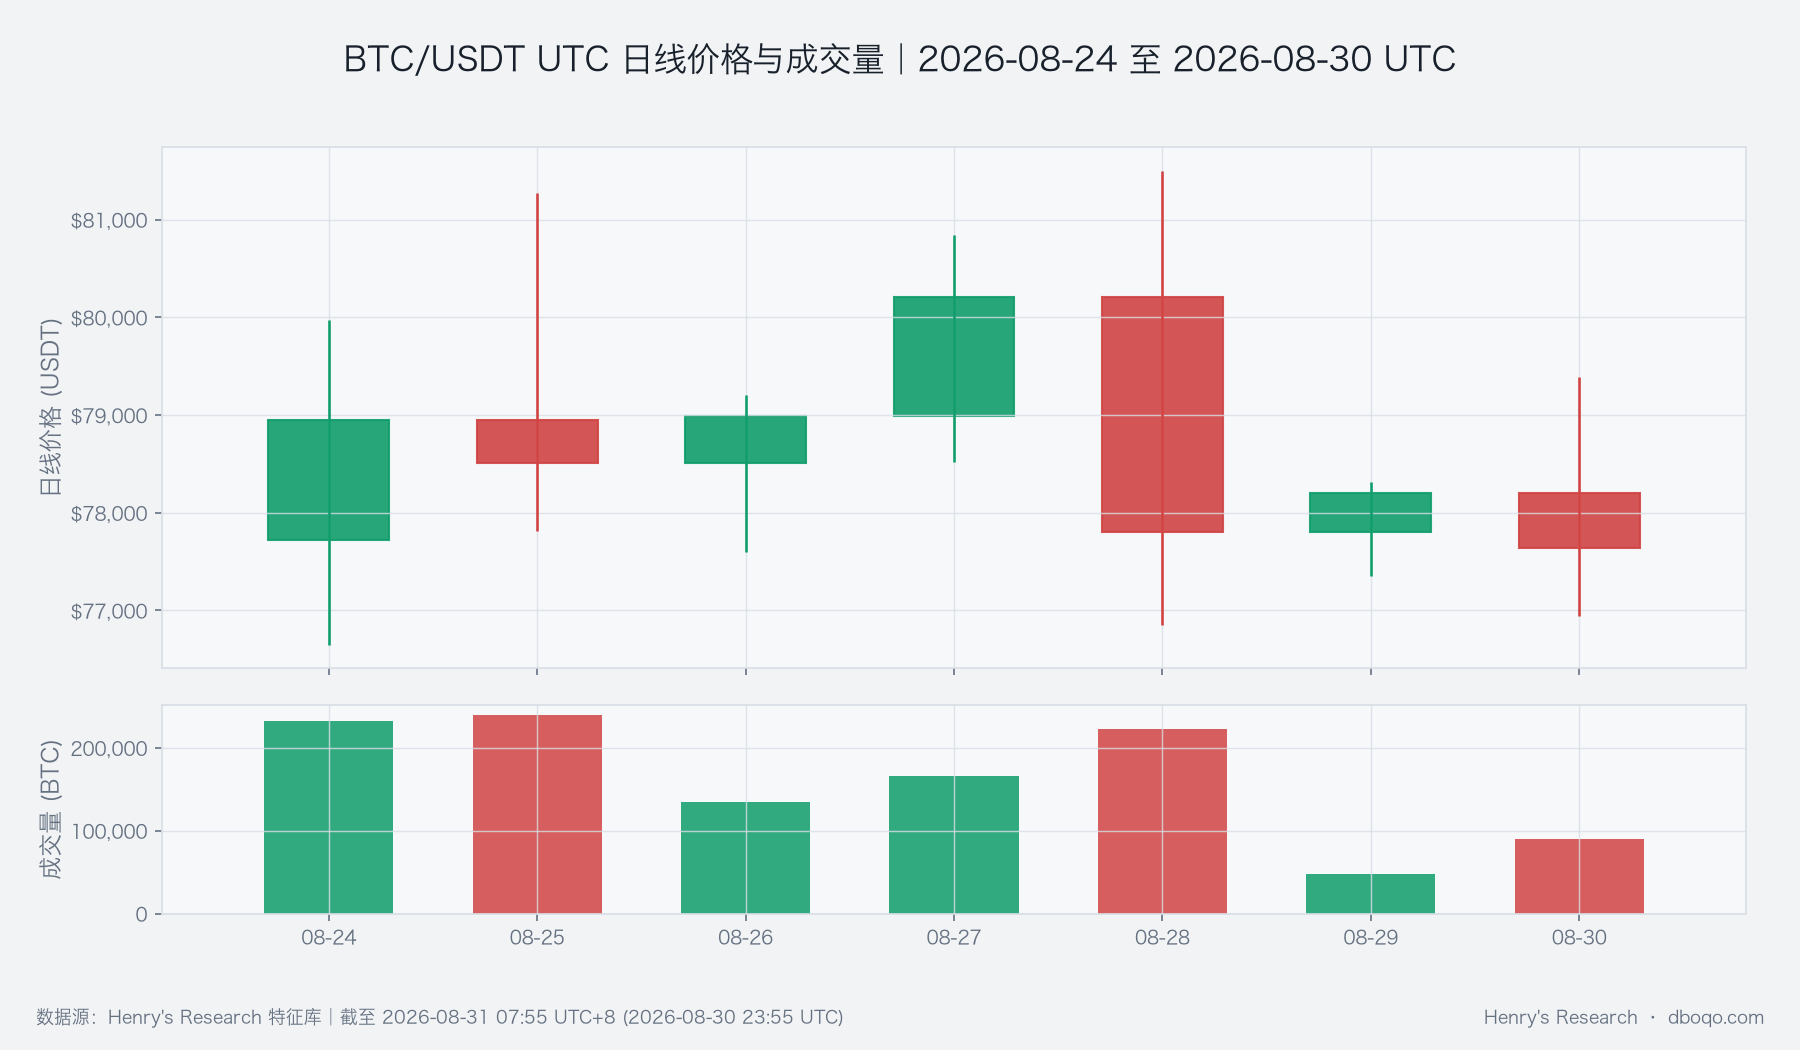
The most important feature in the chart is not the final day's move, but the failure to hold the rally. Next week, watch whether BTC can decisively regain the 10-day moving average near 77,877.47 USDT. A sustained move above it with rising volume would weaken the bearish view; otherwise, rebounds remain tests of resistance.
Four — Price–Volume Structure and Range: Aggressive Selling Dominated, but Local Buying Began to Respond
Weekly volume totaled 1,132,537 BTC, about 10% below its historical mean of 1,264,427 BTC and still within a normal range. This was therefore not a week driven by exceptionally thin or exceptionally heavy turnover. The cumulative slope of aggressive buys minus aggressive sells was -75 BTC versus a historical mean of +4 BTC; only about 8 comparable weeks were as low or lower, showing that order flow over the full week favored aggressive sellers. Yet end-of-period aggressive net-buy intensity reached +0.69, higher than roughly 87% of comparable weeks, indicating that buyers were beginning to respond at lower levels.
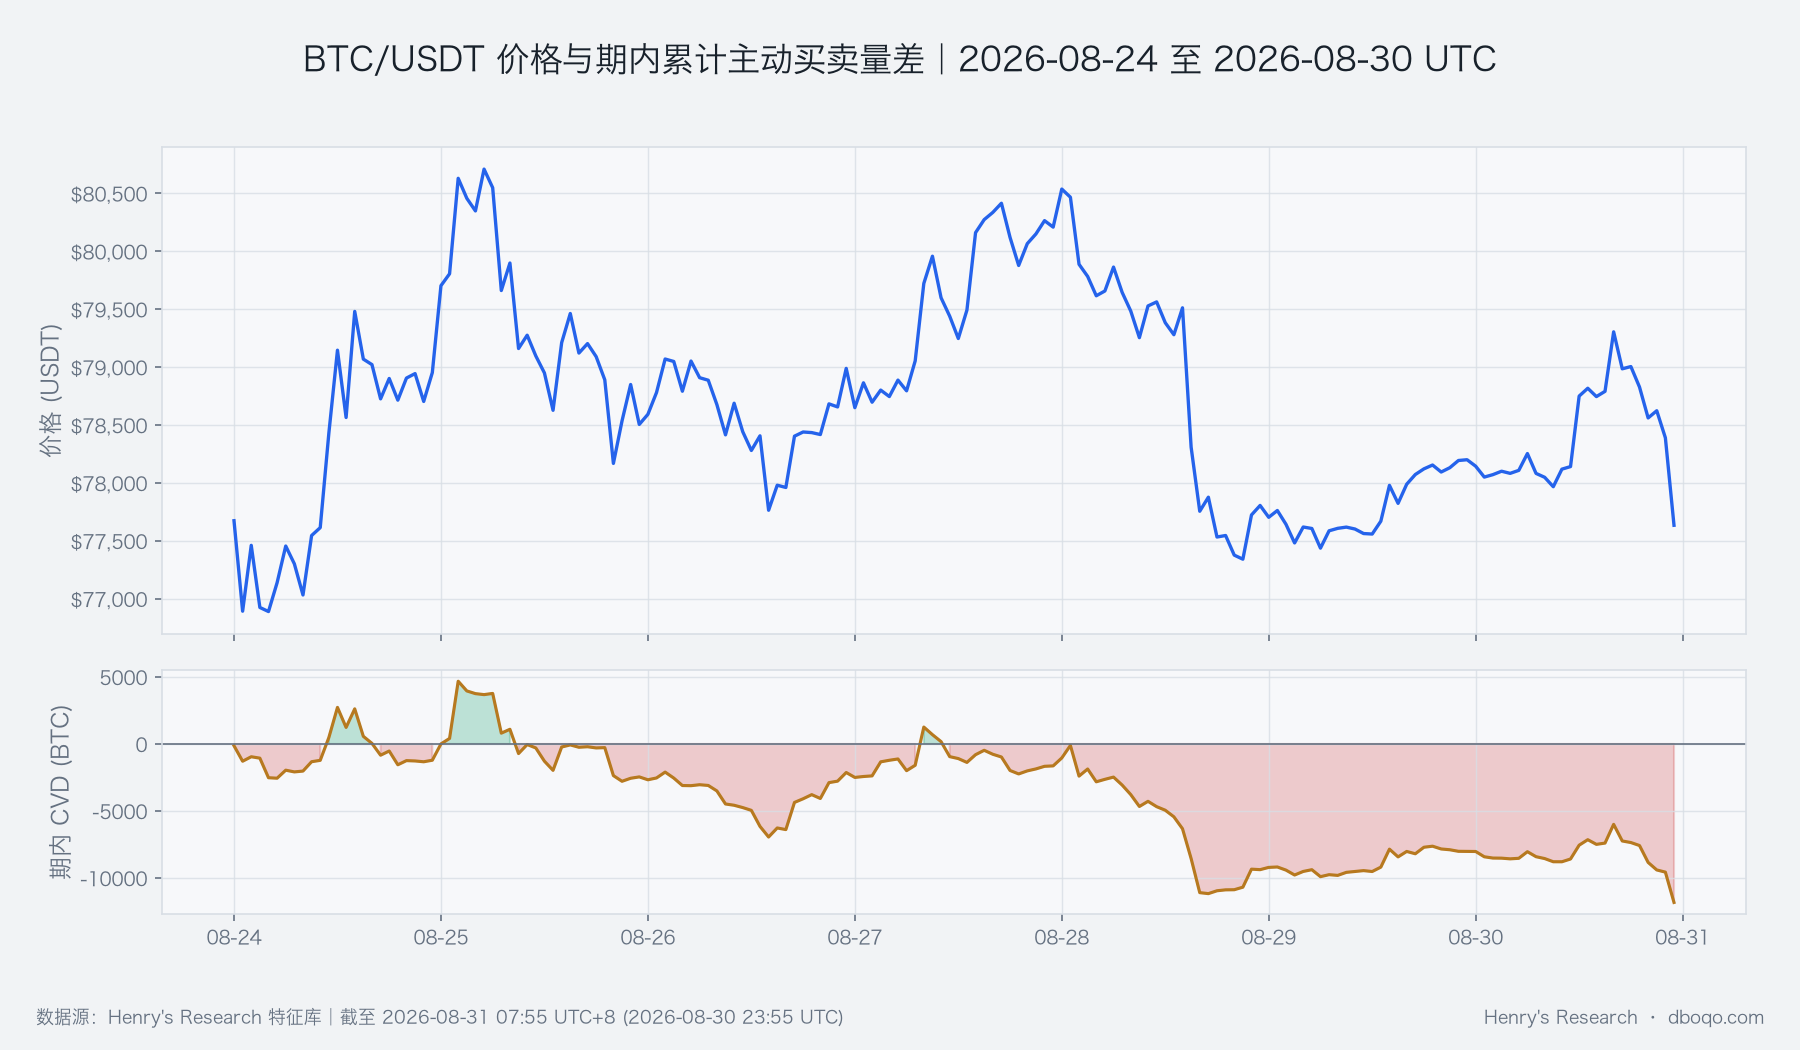
Price's range position was 0.35, below roughly 72% of comparable weeks, while the range amplitude of 2.54% was higher than roughly 80% of them. Price is therefore closer to the lower end of its recent range while its potential swing remains relatively wide. A break below 76,649.00 USDT next week could accelerate selling. Holding that level and reclaiming 81,500.00 USDT would instead turn lower-range demand into more credible reversal evidence.
Five — Derivatives: Financing Costs Are Elevated, but Volatility Pricing Is Not Dislocated
Average weekly funding was +0.008349%, higher than roughly 86% of comparable weeks, indicating elevated financing costs for longs. The futures basis was -0.04%—the difference between futures and spot prices—and ranked relatively high while remaining close to its historical mean. Together, these measures show no extreme panic, but they do reveal an asymmetry between the cost paid by longs and the lack of a price breakout. The implied-versus-realized volatility spread was +1.14, below its historical mean of 2.83. This spread measures the premium in option-implied volatility over recently realized volatility, and it does not currently signal unusually expensive risk pricing. If funding stays elevated while price weakens next week, pressure on longs will increase. If funding cools as price stabilizes, the structure would become healthier.
Six — Cross-Market and Capital Flows: A Neutral Capital Pulse Has Yet to Become a Trend
The BTC cross-market capital pulse was neutral (-0.30), combining the direction of ETF flows, stablecoin supply, the U.S. dollar and VIX. 5-day ETF flow was a net inflow of 3.85 hundred-million U.S. dollars, slightly above its historical mean of 3.45 hundred-million U.S. dollars. Stablecoin supply grew 0.31% over 7 days and 0.59% over 30 days; both remained positive, although the 30-day rate was below its 2.34% historical mean. The U.S. Dollar Index was 99.70 and VIX was 14.43, showing no marked increase in macro risk pressure.
These indicators update at different frequencies. ETF and stablecoin data are daily and may lag, so they cannot be added mechanically or treated as deterministic causes. They show that off-exchange liquidity has not withdrawn broadly, but it has not entered a forceful expansion either. That makes them inconsistent with, but not sufficient to overturn, the bearish price-and-volume evidence. Next week, watch whether inflows persist, whether medium-term stablecoin growth accelerates, and whether those changes ultimately appear in a regained moving average and sustained aggressive buying. The bearish view is truly invalidated only when capital and price move together.
Seven — Composite Signal and Next-Week Scenarios: Bearish Consensus Holds, with Clear Reversal Triggers
The composite signal is bearish. It agrees with the short-term moving averages, MACD, RSI and full-week aggressive selling, and it also confirms the failed weekly rally. It conflicts with ETF inflows, stronger late-period aggressive buying and a neutral capital pulse. The base case is weak consolidation between 76,649.00 and 81,500.00 USDT, with the lower boundary tested first. The bearish extension is a break below 76,649.00 USDT accompanied by expanding aggressive selling. The reversal case requires a volume-backed move above 81,500.00 USDT while ETF flows and stablecoin growth at least do not deteriorate. The judgment should be overturned only by joint improvement in price, volume and capital—not by a rebound in a single oversold measure.
Eight — Risk Disclosure
BTC's unusually negative correlation with U.S. equities may mean-revert quickly, while weekends and thin-liquidity periods can amplify price gaps. Daily capital-flow indicators can be delayed, and derivatives measures can reverse over short intervals. Any breakout or breakdown should be confirmed by volume and the direction of aggressive buying versus selling, rather than treating a single transient move as a new trend.
Disclaimer: This report was prepared by dboqo using market data available through 2026-08-31 07:55 UTC+8. Cryptocurrency markets are highly volatile. This report provides objective analysis of market conditions only and does not constitute investment advice. Investors must assess risks independently and make prudent decisions.