One, Core Finding and Direction: Improving Aggressive Demand Has Not Yet Reversed the Weak Trend
Data context: As of 2026-09-02 08:50 UTC+8, the current observation window covers the past 24 hours and is compared with up to 180 prior 24-hour windows aligned to the same cutoff time. Core finding: BTC fell 1.86% over the past 24 hours and the short-term trend remains weak, but the aggressive buy-sell accumulation slope rose to +144 BTC, showing strong demand emerging during the decline. The market is now caught between a weak trend and improving demand. Historical comparison: The historical mean for the aggressive buy-sell accumulation slope is -12 BTC, and only about 13 of the 180 comparable periods were higher than the current reading. Meanwhile, the MACD histogram is -30.76 USDT versus a historical mean of +1.16 USDT, with only about 15 periods as low or lower. The former signals that short-term buyers are pushing back, while the latter shows that trend momentum has not yet recovered; this divergence is the report's most important judgment boundary.
Scope review: All 13 data-quality checks passed. Units, frequencies, and magnitudes are consistent, with no scope-anomaly candidates, so no evidence needs to be excluded from the directional assessment. Directional view: Bearish. Aggressive demand is strong, but price, trend momentum, ETF flows, and elevated funding rates do not yet confirm it. Assessment horizon: The next 24 hours. Conditions for the view to hold: Price remains capped near the 10-day moving average at 78,396.67 USDT, while MACD stays negative during rebounds and ETF flows do not improve. Invalidation conditions: Price reclaims and holds 78,396.67 USDT, aggressive demand persists and lifts MACD above zero, and funding rates cool rather than rise further.
Two, Key Market Data: The Decline Is Material, but Aggregate Volume Is Not Disorderly
BTC is trading at 77,152.80 USDT after ranging between 76,368.00 and 79,196.00 USDT over the past 24 hours, down 1.86%. This return is lower than about 86% of comparable periods, making the selling pressure meaningful. Yet 24-hour volume of 150,974 BTC is close to the historical mean of 155,718 BTC rather than an extreme selloff reading. This matters because the move looks more like a pullback caused by weakening trend and divided capital signals, not confirmed liquidity stress. Watch whether volume expands materially if price breaks below 76,368.00 USDT; if volume remains normal, confidence in an extended decline would be limited.
Three, Price Action and Trend: Short-Term Momentum Is Weak, While Daily Support Remains Intact
The MACD histogram measures whether short-term trend momentum is accelerating or decelerating. It has fallen to -30.76 USDT versus a historical mean of +1.16 USDT, placing it among roughly the 15 lowest or lower readings across 180 comparable periods and indicating that downside momentum has not yet faded. Short-horizon RSI is 38.68; RSI gauges the balance of upward and downward momentum, and its position below the historical mean of 50.17 also supports a weak near-term view. However, price remains above the 30-day moving average at 70,180.77 USDT, so the medium-term structure has not shifted into synchronized downside acceleration. If MACD improves while price holds 76,368.00 USDT over the next 24 hours, weakness may ease; if both continue lower, aggressive demand is more likely to be only a temporary cushion.
Four, Price-Volume Structure and Price Range: Aggressive Buying Improves, but a Breakout Still Needs Price Confirmation
The aggressive buy-sell accumulation slope is +144 BTC versus a historical mean of -12 BTC, and only about 13 of the 180 comparable periods were higher. This measure tracks the change in aggressive buying minus aggressive selling, and the current reading shows buyers are willing to cross the spread during the decline. Relative volume is 1.04, slightly above its historical norm but not extreme, so the demand is meaningful yet insufficient on its own to reverse the trend. Price is currently in the lower half of its 24-hour range. First watch whether 76,368.00 USDT holds, then whether price can build consecutive gains above 77,152.80 USDT. The price-volume conflict is resolved only when price and aggressive demand move higher together.
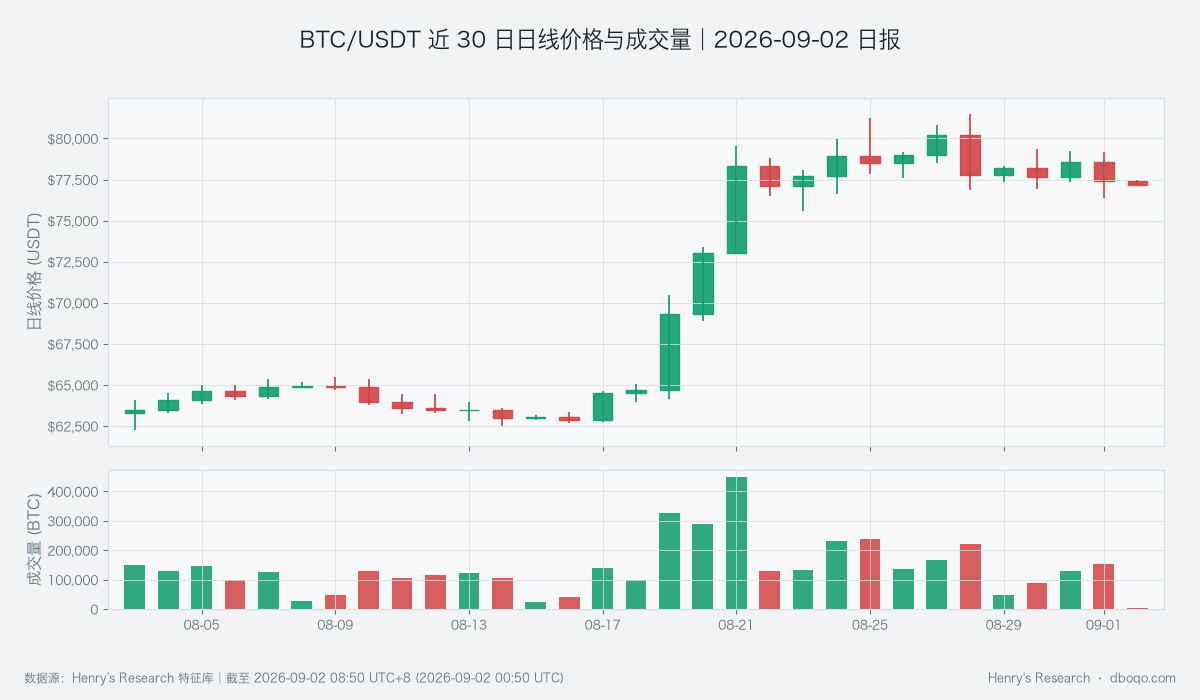
BTC/USDT daily price and volume over the past 30 days
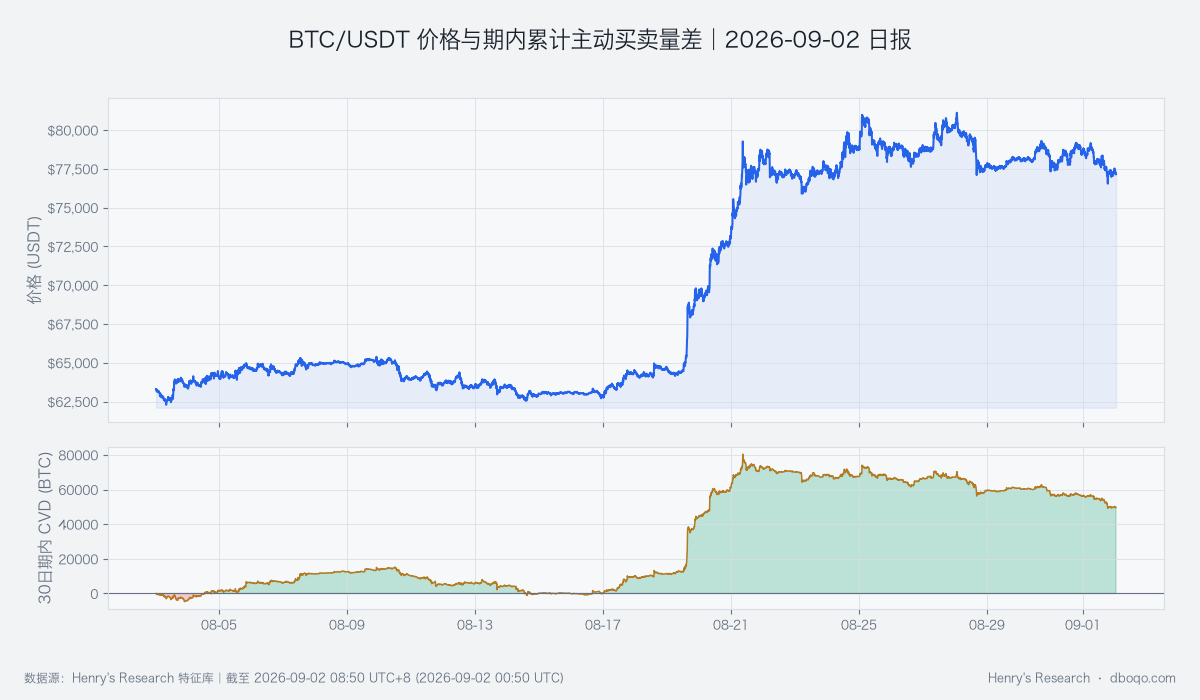
BTC/USDT price and cumulative aggressive buying minus aggressive selling over the past 30 days
Five, Derivatives Anomaly: Elevated Funding Makes Rebounds More Fragile
The average funding rate over the past 24 hours is +0.007423%, well above the historical mean of +0.002484% and higher than about 88% of comparable periods. Funding rates reflect the transfer of costs between the two sides of perpetual contracts. When funding remains elevated as price falls, long-side willingness to pay has not cooled sufficiently, leaving rebounds more vulnerable if spot demand is absent. The futures-spot basis is around -0.04%, still near normal and not yet signaling broad dislocation. The key is not the absolute sign of funding, but whether it declines when price rebounds. If price fails to rise while funding climbs further, the bearish view gains support.
Six, Cross-Market and Capital Conditions: ETF Outflows Offset Medium-Term Stablecoin Improvement
The BTC cross-market capital temperature is neutral. ETFs recorded a net outflow of USD 3.89 hundred million over the past 5 days, below about 64% of comparable periods and pointing to weak short-term demand through traditional channels. Stablecoin supply growth over 7 days is -0.05%, within its normal range, while 30-day growth is +0.62%, higher than about 66% of comparable periods. This suggests medium-term available liquidity is improving but has not yet translated into immediate demand. The US dollar index at 99.62 and VIX at 15.34 do not impose an extreme standalone constraint on BTC. BTC's correlation with US equities is -0.171 versus a historical mean of +0.096; only about 9 of the 180 comparable periods were as low or lower. This means BTC cannot currently rely on US equity direction for confirmation. Capital temperature would be more likely to warm only if ETF flows turn persistently positive and short-term stablecoin growth moves above zero.
Seven, Composite Signal and Scenario Validation: Bearish Consensus Holds, but Improving Demand Is the Counterevidence
The composite signal is bearish, consistent with the price decline, weak MACD, ETF outflows, and elevated funding rates. Stronger aggressive buying is the most important contrary evidence, indicating that further downside requires more confirmation. The base case is weak consolidation between 76,368.00 and 78,396.67 USDT, with rebound potential constrained by trend and capital conditions. The bearish scenario is validated if 76,368.00 USDT breaks on rising volume. Conversely, the current view is overturned and shifts toward neutral or even bullish if price holds above the 10-day moving average, MACD turns positive, aggressive demand persists, and ETF flows improve.
Eight, Risk Disclosure
The current conclusion depends on price-volume behavior, funding rates, and cross-market capital changes over the next 24 hours. Unexpected macro news, regulatory events, or large capital flows could quickly alter the structure. The unusually negative relationship with US equities also reduces the stability of cross-asset references, so the stated price levels should be treated as validation conditions rather than deterministic targets.
Disclaimer: This report was prepared by dboqo using market data available as of 2026-09-02 08:50 UTC+8. Cryptocurrency markets are highly volatile. This report provides objective analysis of market conditions only and does not constitute investment advice. Investors must assess risks independently and make prudent decisions.