I. Core findings and direction: Strong ETF inflows have yet to support prices
Data context: As of 2026-09-24 09:30 UTC+8, prices and trading volume cover the latest 24 hours and are compared with 180 historical periods at the same cutoff. ETF figures use the trailing 5-day net flow known at each cutoff, rather than a single day's inflow.
Core finding: ETF inflows are exceptionally strong, yet BTC is still retreating. Improving funding conditions alongside price pressure suggest that a recovery has a foundation, but market confirmation remains absent. Historical comparison: ETF net inflows over 5 days reached USD 32.94 hundred million, against a historical mean of USD 0.18 hundred million in net inflows. Among 180 comparable periods, approximately 0 were higher, placing the current reading at an unusually high level. This is an important indication of potential buying support, but it does not establish that inflows will immediately lift prices.
Measurement review: No potential unit, frequency or scale anomalies were identified. The exceptional ETF reading is a statistical market move; low-frequency cumulative amounts have not been repeatedly added across intraday observations. Historical mean net flows reflect the offset between inflows and outflows, so a near-zero mean should not be used to exaggerate the increase. Directional view: Conditionally bullish. Horizon: The next 24 hours. Conditions: The recent low holds, aggressive buying continues to improve, and the capital backdrop stays warm. Invalidation: A break below the recent low with renewed selling pressure, or a material weakening in funding support, would require withdrawing the bullish view.
II. Key market data: Elevated-volume selling is the main counterargument
BTC traded at 84,340.30 USDT, with a 24-hour change of -2.57%, versus a comparable-period mean of +0.15%. Among 180 comparable periods, only about 11 were as low or lower. Price performance shows that favorable funding has not reversed the current pressure. Strong ETF inflows are insufficient grounds to disregard the decline already under way.
Volume over the same period was 205,439 BTC, against a historical mean of 149,927 BTC, higher than about 83% of comparable periods. A decline accompanied by elevated activity means that selling must be absorbed through actual transactions. The hurdle for recovery is therefore higher than after a low-volume pullback. The next test is whether stabilization comes with sustained buying support, rather than trading activity alone; higher volume has no fixed directional meaning.
III. Price action and trend: Holding the low matters more urgently than the funding narrative
The observation range ran from a low of 83,450.10 USDT to a high of 87,247.30 USDT. The current price remains in the lower part of that range, indicating an incomplete recovery from the retreat off the high. The low directly tests the bullish scenario, while the high helps assess whether overhead pressure has been absorbed. Both are observed price boundaries, not certain targets.
Remaining above the preceding daily moving averages does not erase the short-term decline. Different horizons can show a stronger broader backdrop alongside weaker current price action. The daily trend cannot guarantee a rise in the next period. Watch for repeated buying support near the low and whether any rebound retains newly established support. If the low fails, favorable funding alone cannot sustain the original view.
IV. Price-volume structure and price range: Improving aggressive buying still needs to persist
The recent trend in cumulative aggressive buying minus aggressive selling was +171 BTC, against a historical mean of -11 BTC. Among 180 comparable periods, only about 18 were higher. This measures recent trading initiative: a positive reading indicates improving short-term buying pressure and supports the prospect of recovery after a decline. It does not mean buyers dominated the entire observation window, nor does it measure total new capital.
This improvement runs against the period's price decline and is best treated as provisional evidence of demand. If aggressive buying stays positive and price lows stop falling, price-volume evidence would move closer to the bullish funding signal. If the improvement fades quickly, the rebound would lack support for continuation. The cumulative curve below covers a longer interval. Its relationship with price matters; its cumulative level must not be added to the latest trend reading.
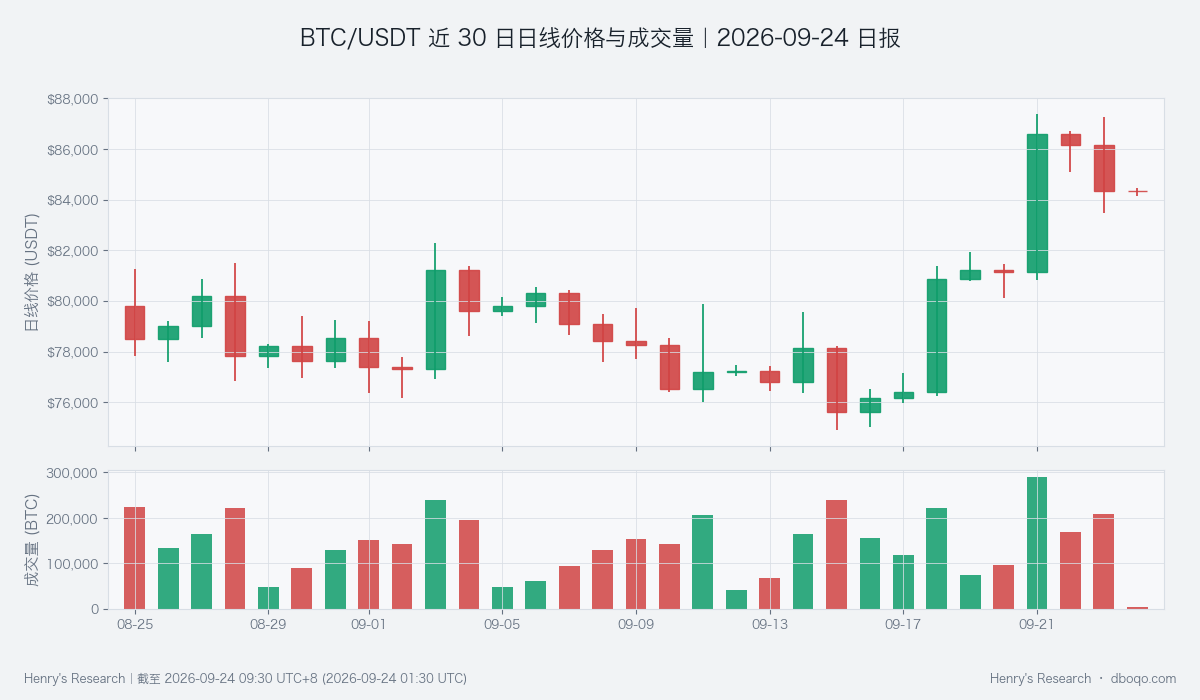
Price and volume over 30 days: Look for buying support during the pullback. The last day is incomplete, so its volume is not directly comparable with a full day.
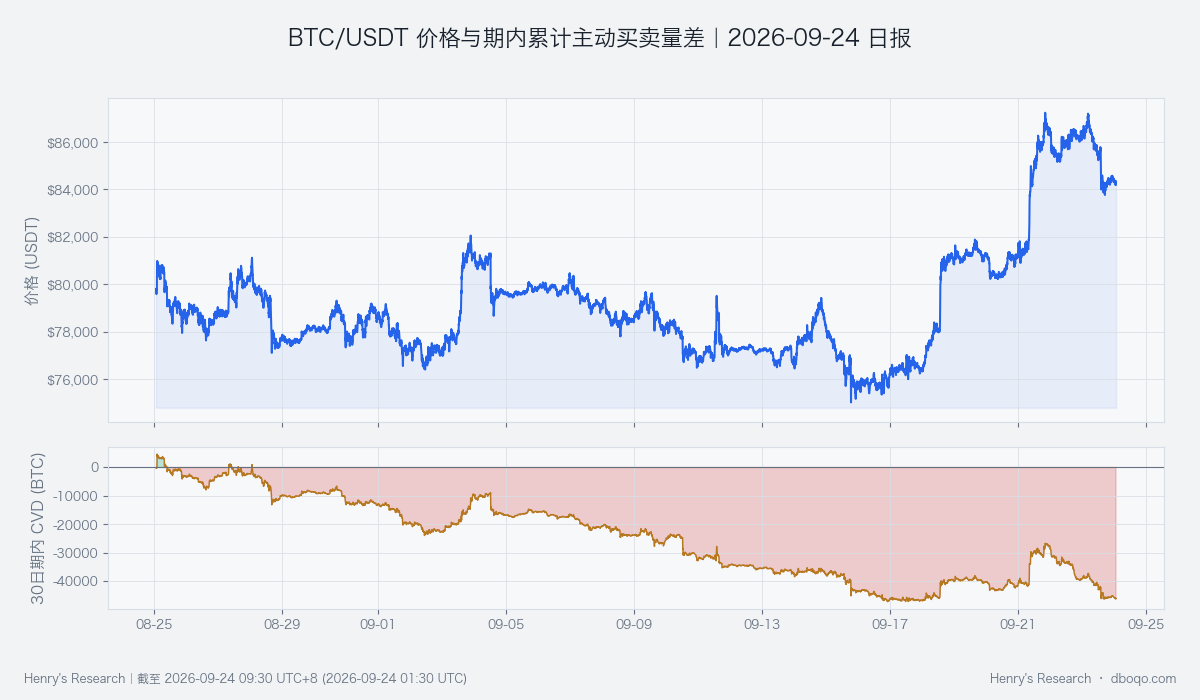
Price and cumulative aggressive buying minus aggressive selling over 30 days: Watch whether improving buying translates into price stabilization.
V. Derivatives: Subdued financing demand does not confirm a strong advance
The funding rate measures periodic payments between long and short participants in perpetual contracts. The average rate over the observation window was +0.000822%, versus a historical mean of +0.003348%, lower than about 73% of comparable periods. The subdued reading means bullish appetite has not translated into strong financing demand. It can ease overheating concerns, but cannot establish that a bottom has formed.
This is a window average, not an individual latest reading or a daily return. Derivatives offer no strong evidence sufficient to overturn the price decline. The bullish case therefore still requires joint confirmation from price and actual buying. Stabilizing prices with moderate financing costs would make a recovery more sustainable. Rising costs alongside further price weakness would instead warn that enthusiasm is becoming detached from buying support.
VI. Cross-market conditions and capital: A warm capital backdrop still faces dollar pressure
The BTC cross-market capital pulse is warm. Strong ETF inflows and expanding stablecoin supply provide support, relative dollar strength offsets part of that benefit, and volatility pressure has not outweighed the overall funding improvement. More stablecoin supply represents potentially available liquidity, rather than direct BTC purchases. Cumulative ETF inflows may also be out of step with current price adjustments. The pulse describes a more favorable environment, not an immediate price forecast.
Relative dollar pressure is unusually elevated and remains an important counterargument to the funding narrative. Even with stronger funding channels, macroeconomic pressure can reduce the prices market participants are willing to accept. Watch whether ETF support continues, stablecoin expansion coincides with actual buying, and dollar pressure eases. A cooling capital backdrop would materially weaken the foundation of the recovery case.
VII. Combined signal and scenario tests: The bullish case depends on buying support materializing
The combined signal is bullish, consistent with warm capital conditions and improving recent aggressive buying, but at odds with the elevated-volume decline. The evidence is not in full agreement. The conclusion is therefore a conditional recovery bias, rather than a claim that the decline has ended. Validation should begin with whether prices stop falling, then assess persistence in buying, followed by continued funding improvement.
The base case is that the low holds and improving buying gradually stabilizes prices. A stronger scenario requires prices to reclaim overhead resistance while retaining demand. A rebound without sustained buying could still lead to repeated range trading. A break below the low with stronger aggressive selling would invalidate the bullish view. If funding support also weakens, the decline should no longer be treated as a temporary interruption within the original recovery scenario.
VIII. Risks
Historical rankings describe relative rarity, not the probability of a future rise. Rolling cumulative funding observations overlap and do not represent independent daily capital shocks. Macroeconomic releases and cryptocurrency trading periods are not synchronized, and associated changes do not establish causation. Unexpected events and shifts in liquidity can move prices beyond the observed boundaries. This report's conditional assessment requires reassessment as new evidence emerges.
Disclaimer: This report was prepared by dboqo using market data as of 2026-09-24 09:30 UTC+8. Cryptocurrency markets are highly volatile. This report provides an objective analysis of market conditions and does not constitute investment advice. Investors must assess risks independently and make prudent decisions.