I. Core finding and direction:Aggressive buying weakens after a high-volume rally
Core finding: The main concern is not the size of the rally itself, but weaker follow-through from buyers after the advance. The cumulative trend in aggressive buying minus selling has fallen to a rare low, contrasting with a strong rise in both price and trading volume across the day. The rally involved broad trading participation, yet this does not guarantee that buyers still dominate the latest period. Near-term pullback risk has increased, but capital conditions have not cooled across the board, so a bearish view needs explicit invalidation conditions.
Data context: As of 2026-09-22 10:15 UTC+8, the observation covers the latest 24 hours and compares them with 180 historical windows ending at the same time of day. Trend readings use each window's endpoint, while capital indicators retain their respective observation periods. Historical comparison: The cumulative trend in aggressive buying minus selling is -536 BTC, versus a historical mean of -12 BTC. Among 180 comparable periods, only about 2 were as low or lower, making this an unusually weak reading. This indicator describes the trend in cumulative aggressive buying minus aggressive selling; it is not the monetary value of net outflows over the full day. It signals weaker recent buying support. The next test is whether that weakness persists and whether prices regain support from buyers.
Measurement review: There are no measurement-anomaly candidates this period. The main differences are statistical market anomalies. Volume is accumulated across the window, daily capital indicators are not repeatedly added, and short-term trends are not conflated with full-day turnover. Directional view: Bearish bias. Horizon: The next 24 hours. Conditions for validity: The aggressive buying-minus-selling trend stays weak, and price recoveries fail to attract sustained buying support. Invalidation conditions: Aggressive buying recovers persistently, price regains the upper part of the range, and capital conditions remain stable. That combination would require reassessing the bearish case.
II. Key market data:Strong returns and turnover challenge the bearish view
BTC trades at 85,572.00 USDT, up +5.09% over the latest 24 hours, against a historical mean return of +0.10%. Among 180 comparable periods, only about 3 had higher returns, an unusually strong result. This indicates substantial upward price pressure earlier in the window. Weaker buying at the endpoint does not negate the entire rally. The next distinction is between normal consolidation after an advance and a sustained decline caused by inadequate buying support.
Volume reached 281,268 BTC, compared with a historical mean of 149,428 BTC. Among 180 comparable periods, only about 8 recorded higher turnover. Activity is unusually strong and participation has broadened, but turnover includes both buyers and sellers and is not equivalent to net buying. Strong activity accompanied by stable prices and recovering aggressive demand would challenge the bearish view. Continued price declines despite active trading would instead support the interpretation that near-term pressure remains unresolved.
III. Price action and trend:The daily recovery remains intact, but recent momentum has cooled
The latest 24-hour price range is 81,113.90 to 87,385.10 USDT, and price has retreated from the upper boundary. This range provides context for judging buying support; its boundaries are not guaranteed support or resistance. The important questions are whether the decline stabilizes and whether rebounds repeatedly fail. Merely touching a particular level cannot establish that direction has changed.
Daily price remains above recent short- and medium-term moving averages, while the latest short-term moving-average relationship has weakened. Different horizons are diverging. The former suggests the longer-horizon recovery has not fully broken down; the latter indicates declining recent momentum. The bearish bias therefore concerns near-term follow-through risk, rather than an inevitable reversal of the longer-horizon trend. If recent weakness fails to affect the price structure, conviction should be reduced.
IV. Price-volume structure and price range:Full-day turnover cannot offset selling pressure at the endpoint
The rare low in the cumulative aggressive buying-minus-selling trend is the central evidence this period. At the same time, the latest aggressive net-buying intensity remains above its historical norm. These measures do not capture exactly the same temporal behavior: local buying can improve without immediately reversing a cumulative trend. A brief improvement is not sustained support, and a negative trend does not mean that every period experienced net selling.
A more useful test combines price stabilization after the decline, persistent improvement in aggressive demand, and the ability of active trading to generate upward price progress. If the buying-minus-selling trend improves but price still cannot strengthen, supply pressure may remain unresolved. If price and aggressive demand recover together, the principal evidence behind the bearish case would weaken.
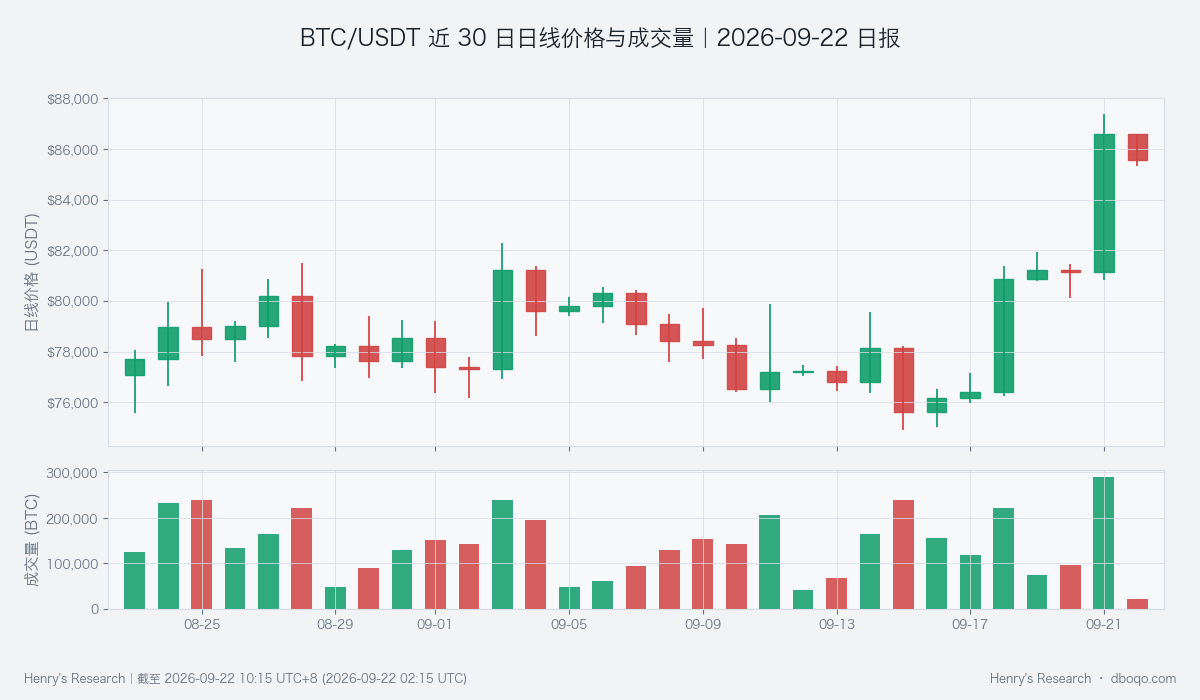
BTC/USDT daily price and volume over the latest 30 days, used to assess whether the advance accompanies broader participation.
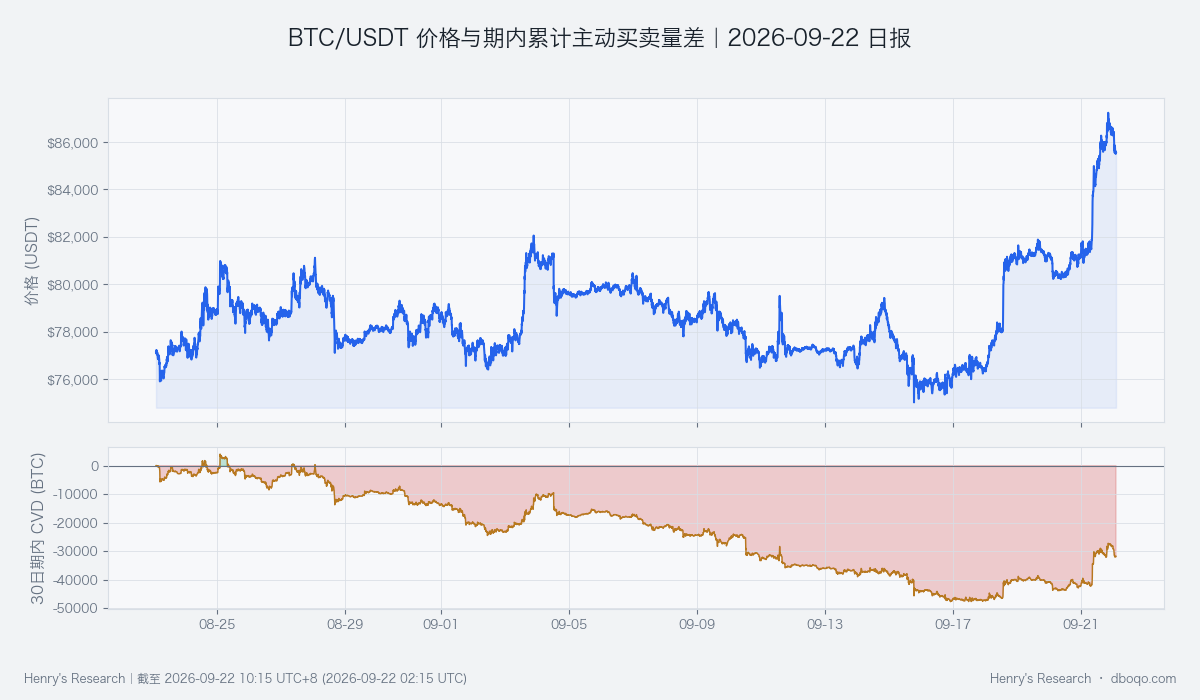
BTC/USDT price and cumulative aggressive buying minus aggressive selling over the latest 30 days. The cumulative level and its latest trend are different measures.
V. Derivatives developments:Elevated funding costs do not yet signal broad stress
Perpetual funding rates represent periodic payments between counterparties. The average across this window is +0.006898%, versus a historical mean of +0.003293%, higher than about 79% of comparable periods. This is an elevated window-average rate, not a cumulative payment amount or the latest instantaneous quote. Positive funding indicates that bullish demand carries a cost, but cannot independently determine the subsequent price direction.
As price retreats from its high, elevated financing costs make demand persistence more important to test. However, this reading does not meet the statistical-anomaly criterion for the period, so it does not establish broad derivatives-market stress. Stabilizing prices, recovering aggressive demand and costs that stop rising could ease near-term risk. Persistently elevated costs alongside fading buying would instead increase uncertainty about follow-through.
VI. Cross-market and capital conditions:Neutral capital temperature limits a one-sided bearish view
BTC cross-market capital temperature is neutral. ETF net inflows over 5 days amount to 14.59 hundred million US dollars, more constructive than the historical mean net outflow of 0.13 hundred million US dollars. Among 180 comparable periods, only about 17 recorded higher flows, an unusually strong level. This is important counterevidence to the bearish case, showing support over a longer capital-flow window. Continued inflows should be monitored, but they are not instantaneous buying during the current day and cannot be said to have directly caused this rally.
Short-term stablecoin supply is roughly flat, its longer window shows modest expansion, relative dollar pressure is elevated, and US equity volatility risk reflected by VIX remains within its normal range. Together, these do not establish a broad warming in capital conditions. BTC's linkage with US equities is also unusually high, warranting attention to external risk sentiment; correlation itself does not determine direction. Stable capital support could absorb near-term selling pressure. Stronger dollar pressure and higher risk volatility together would weaken that cushion.
VII. Combined signal and scenario tests:The bearish bias fits recent price-volume behavior, but counterevidence remains
The combined signal is bearish, consistent with weaker aggressive buying minus selling at the endpoint and cooling short-term trends. It is not fully aligned with the high-volume rally across the day or supportive ETF flows. The base case is that the rally's follow-through is being tested, rather than a predetermined return to its starting price. A cautious near-term view remains supported while the cumulative buying-minus-selling trend is weak and rebounds lack sustained demand.
The opposing scenario is persistent recovery in aggressive buying, renewed upward price progress and capital temperature that does not cool. Those developments would invalidate the bearish view. If prices stabilize but demand and capital conditions continue to offset one another, a range-bound scenario should be accepted. Historical rarity identifies a development worth watching. Direction must still be tested against subsequent conditions; an extreme reading cannot substitute for subsequent market behavior.
VIII. Risk considerations
Historical ranks are not probabilities of future price moves, and statistical anomalies are not necessarily data errors. Indicators differ in observation windows and update frequency, so lower-frequency capital data may not immediately reflect short-lived shocks. High volume can accompany either trend continuation or growing disagreement, while unexpected events can change the external risk environment. This assessment applies only to the stated horizon and conditions. A conditional directional bias is not a certain outcome.
Disclaimer: This report was prepared by dboqo using market data as of 2026-09-22 10:15 UTC+8. Cryptocurrency markets are highly volatile. This report is an objective analysis of market conditions only and does not constitute investment advice. Investors must assess risks independently and make prudent decisions.