I. Core finding and direction: Strong ETF inflows coexist with contracting open interest
Data context:As of 2026-09-25 08:45 UTC+8, the current observation covers the latest 24 hours and is compared with 180 historical windows sharing the same cutoff time. ETF flows use the latest 5-day net total; the open-interest change measure uses its average within the window. Each is compared with history on the same basis.
Core finding:ETF funding is unusually strong, yet futures participation is contracting and prices have recovered only modestly. This supports a funded recovery but does not establish broad participation in the advance. Historical comparison:ETF net inflows are 28.41 hundred million US dollars, versus historical mean net inflows of 0.36 hundred million US dollars. Among 180 comparable periods, only about 3 were higher, making this an unusually elevated reading. Meanwhile, the open-interest change measure averages -7.55%, versus a historical mean of +0.15%; only about 2 comparable periods were as low or lower. The divergence deserves more attention than inflows alone.
Measurement review:No candidates for unit, frequency or scale anomalies were identified; these departures are statistical market anomalies. The average contract-change measure is not the total decline in contracts over 24 hours, and the 5-day ETF amount is not fresh buying for the day. They cannot be added together or used to infer prices directly. Directional assessment:Conditionally bullish. Assessment horizon:The next 24 hours. Conditions for confirmation:The lower boundary of the recent price range holds, aggressive buying continues to improve, and activity confirms acceptance of the upper boundary. Invalidation conditions:A break below the lower boundary accompanied by stronger selling, or a material reversal in external funding support, would invalidate the bullish assessment.
II. Key market data: A modest recovery has yet to confirm funding transmission
BTC/USDT stands at 84,611.10, up 0.39% over the latest 24 hours versus a historical mean of +0.15%. It is higher than about 61% of comparable periods and remains an ordinary move. Prices have not produced an equally unusual advance alongside strong funding readings, indicating that transmission from inflows to immediate demand remains unconfirmed. Watch whether funding support becomes sustained buying interest, instead of treating a small gain as trend acceleration.
Volume is 160,249 BTC versus a historical mean of 149,903 BTC, higher than about 62% of comparable periods and slightly above normal. Participation is not depressed, but neither is there unusual expansion sufficient to confirm a strong breakout. The gap between funding and prices is more likely to narrow if activity strengthens as prices extend higher. Rising volume without price progress would instead warrant attention to overhead supply.
III. Price action and trend: The range ceiling is the test for recovery
The latest 24-hour range is 82,832.00 to 84,901.60 USDT. The latest price is near its upper boundary, showing that a recovery from lower levels has occurred but not that the range has decisively broken. Sustained buying interest at the ceiling matters more than a brief touch. Repeated tests followed by retreats inside the range would support recovery, without confirming an accelerating one-way advance.
The daily close remains above short- and medium-term moving averages, aligning the trend backdrop with a bullish assessment. Daily structure reacts slowly, however, and cannot replace confirmation from current trading activity. The lower boundary tests whether the recovery is losing its foundation; it does not guarantee support. A break followed by a rapid reclaim should be interpreted differently from a break followed by further weakness, rather than revising the view from a momentary price alone.
IV. Price-volume structure and range: Buying improvement remains ordinary
The cumulative trend in aggressive buying minus aggressive selling helps assess whether buyers are driving activity. Its latest reading is +29 BTC versus a historical mean of -5 BTC, higher than about 61% of comparable periods. Buyer impetus has improved slightly, consistent with the price recovery, but its strength is not unusual. This supports the bullish view without independently explaining why ETF inflows have yet to produce a stronger price response.
Range analysis focuses on acceptance after a breakout, rather than assigning inevitability to a proportional line. Activity near the upper boundary, buyer-versus-seller impetus and the depth of pullbacks should be considered together. Persistent aggressive buying during a breakout and reduced supply on pullbacks would strengthen the recovery assessment. A new price high accompanied by weakening buyer impetus would dilute the existing bullish evidence.
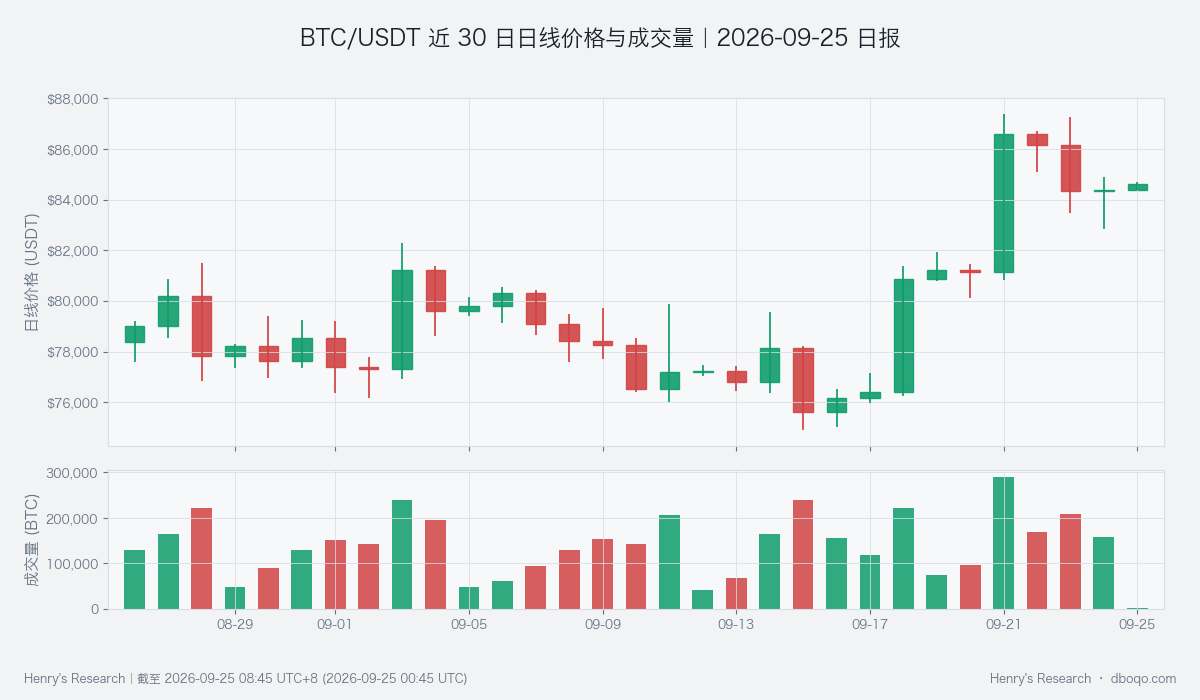
BTC/USDT daily price and volume over the latest 30 days
V. Derivatives anomaly: Contract contraction does not establish selling pressure
Open interest represents market contracts that remain outstanding. Its change measure has been persistently weak within this window, making it the leading market anomaly. Contraction can accompany risk reduction or the departure of existing participants; without a directional breakdown, it cannot automatically be read as fresh bearish activity. Rising prices alongside contract contraction highlight the need to test the participation base behind the recovery.
The window average must also be distinguished from the final observation: the former describes the overall condition during the period, while the latter describes only the cutoff. This report uses like-for-like historical comparisons and does not combine these readings into evidence of acceleration or deceleration. Recovery quality would improve if contract contraction eased, aggressive buying persisted and prices held above the range ceiling. If price and participation weaken together, the directional view should be reassessed first.
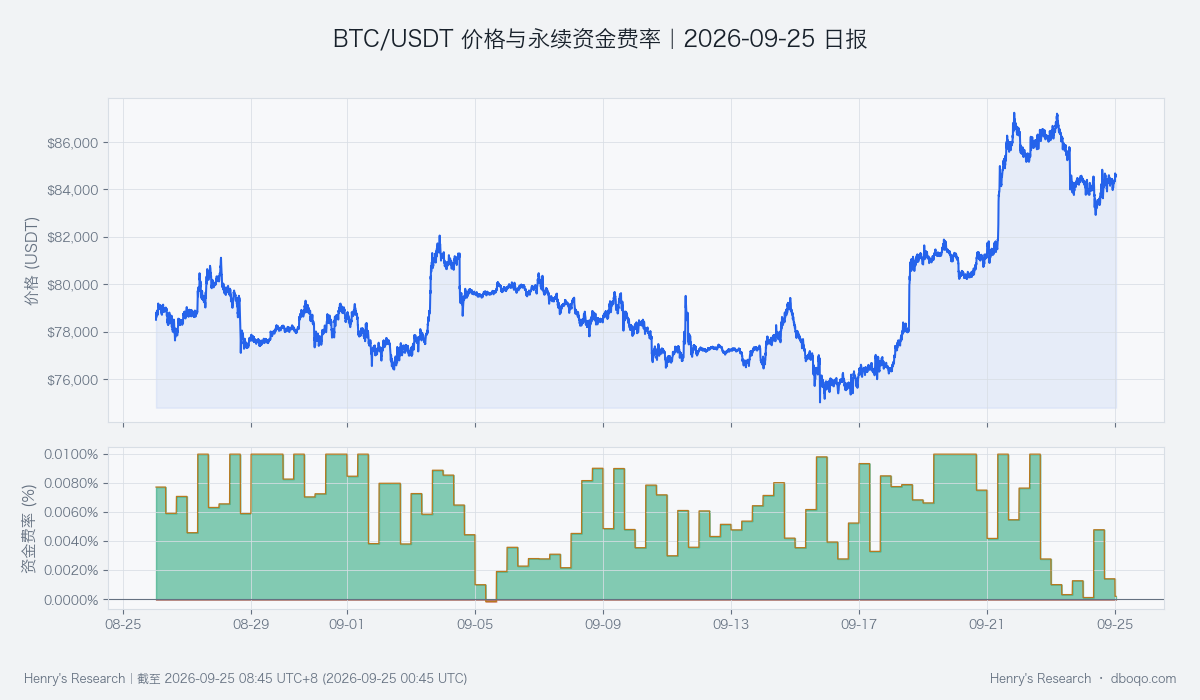
BTC/USDT price and perpetual funding rate over the latest 30 days
VI. Cross-market conditions and funding: Neutral funding temperature limits the inflow narrative
The BTC cross-market funding temperature is neutral. ETF inflows and growth in stablecoin supply provide support, offset by dollar strength and volatility-related risk factors. Funding conditions therefore do not show a broad-based warming. ETF flows are realized funding over a period, while stablecoin supply reflects potential liquidity; neither guarantees purchases of BTC in the next interval. The dollar and volatility are conditional constraints, not established causes.
These offsets explain why strong ETF inflows do not remove the need for price confirmation. Watch whether funding improvement spreads across more channels and dollar pressure eases. Persistent inflows can still coexist with limited price response if macroeconomic risks rise at the same time. An elevated historical ranking for ETF flows is no reason to disregard contradictory evidence.
VII. Composite signal and scenarios: Bullish confirmation requires sustained buying activity
The composite signal is bullish, consistent with recovering prices, improving buyer impetus and ETF funding support. It is not fully aligned with contracting futures participation and neutral overall funding conditions. The assessment is therefore a conditional continuation of recovery, not a promise of subsequent gains. The key checks are whether the range holds, whether its upper boundary gains acceptance and whether buyers continue to drive activity.
A break above the ceiling with sustained trading support would strengthen the bullish view. Continued movement inside the range with balanced buyer and seller impetus would favor a range-bound interpretation. A failure of the lower boundary accompanied by stronger selling would invalidate the assessment. A material reversal in funding would also erode its foundation; acknowledging change need not wait for every slow-moving indicator to turn.
VIII. Risks
Historical ranking describes rarity, not the probability of a future direction. Extreme inflows can persist or reverse. Observations at different frequencies update asynchronously, contract size does not distinguish every participant motive, and brief moves outside a range can reverse quickly. This report applies only to the stated window and requires reassessment as new funding or price evidence arrives. In particular, correlation should not be mistaken for completed transmission of funding into prices.
Disclaimer:This report was prepared by dboqo using market data as of 2026-09-25 08:45 UTC+8. Cryptocurrency markets are highly volatile. This report provides an objective analysis of market conditions only and does not constitute investment advice. Investors must assess risks independently and make prudent decisions.