I. Core finding and direction:Stronger equity co-movement, but improving liquidity has yet to strengthen prices
Core finding: The most important change is stronger co-movement between BTC and US equities, while expanding available liquidity has yet to reverse short-term price weakness. Rising correlation does not itself imply an upward or downward move. It makes external risk appetite more relevant to the BTC outlook; stablecoin growth and ETF inflows cannot be equated with an imminent price rise.
Data scope: As of 2026-09-26 08:45 UTC+8, price and volume cover the preceding 24 hours at the same cutoff, with 180 comparable historical periods. Correlation uses a 30-day measure, while ETF and stablecoin figures retain their respective multi-day horizons and are not treated as fresh daily inflows.
Historical comparison: BTC’s correlation with US equities is +0.407 versus a historical mean of +0.062. Of 180 comparable periods, approximately 0 had a higher reading, placing it at a rare high. This indicates more pronounced co-movement than before, rather than predicting equities’ next move or implying that every price change will have the same direction. The next test is whether changing risk appetite coincides with a break of BTC’s range.
Measurement review: Stronger correlation and stablecoin expansion are statistical market developments; no candidates for unit, frequency or scale inconsistencies were identified. Multi-day capital figures have not been repeatedly summed at intraday frequency, and the window average of the contract-change indicator is not interpreted as the full-day change in total contracts. Historical rarity and measurement distortion are different issues.
Directional judgment: Bearish, with improving liquidity limiting conviction. Judgment horizon: The next 24 hours. Conditions for validity: Price fails to reclaim the upper range boundary decisively, short-term momentum remains weak, and liquidity expansion fails to become sustained aggressive buying. Invalidation conditions: Price breaks above the upper boundary and holds, aggressive buying improves persistently, and derivatives demand stabilizes. That combination would require withdrawing the bearish judgment.
II. Key market data:A pullback on ordinary volume is not yet panic selling
BTC trades at 83,882.30 USDT, down 0.86% over the past 24 hours, versus a historical average gain of 0.15%. The return is lower than approximately 73% of comparable periods and modestly below normal. This supports short-term weakness, but does not justify upgrading an ordinary pullback to a collapse in trend. The next test is whether a rebound attracts supporting volume rather than simply producing a single upward price move.
Volume over the same period is 133,211 BTC versus a historical mean of 150,301 BTC, within the ordinary range. Participation has not surged to an extreme, so the decline lacks volume evidence of panic. Equally, a rebound without sustained turnover would not demonstrate that favorable liquidity conditions are translating into demand. Volume tests the breadth of price moves here; it does not independently determine direction.
III. Price action and trend:Daily support remains, but short-term momentum is a drag
Price remains above the 10-day moving average of 82,131.14 USDT, suggesting that the preceding upward structure has not fully broken down. The bearish judgment primarily concerns the short term. A moving average summarizes past prices and is not guaranteed support. If the pullback deepens, the test is whether buyers respond around this area, rather than dismissing recent weakness simply because price remains above the average.
The MACD histogram tracks the difference between faster and slower price trends. Its current short-period reading is -26.25 USDT versus a historical mean of +1.27 USDT; approximately 18 of 180 comparable periods were as low or lower, indicating weak immediate momentum. This does not contradict remaining daily support because the observation horizons differ. Only a recovery in short-term momentum confirmed by price would materially weaken the present judgment.
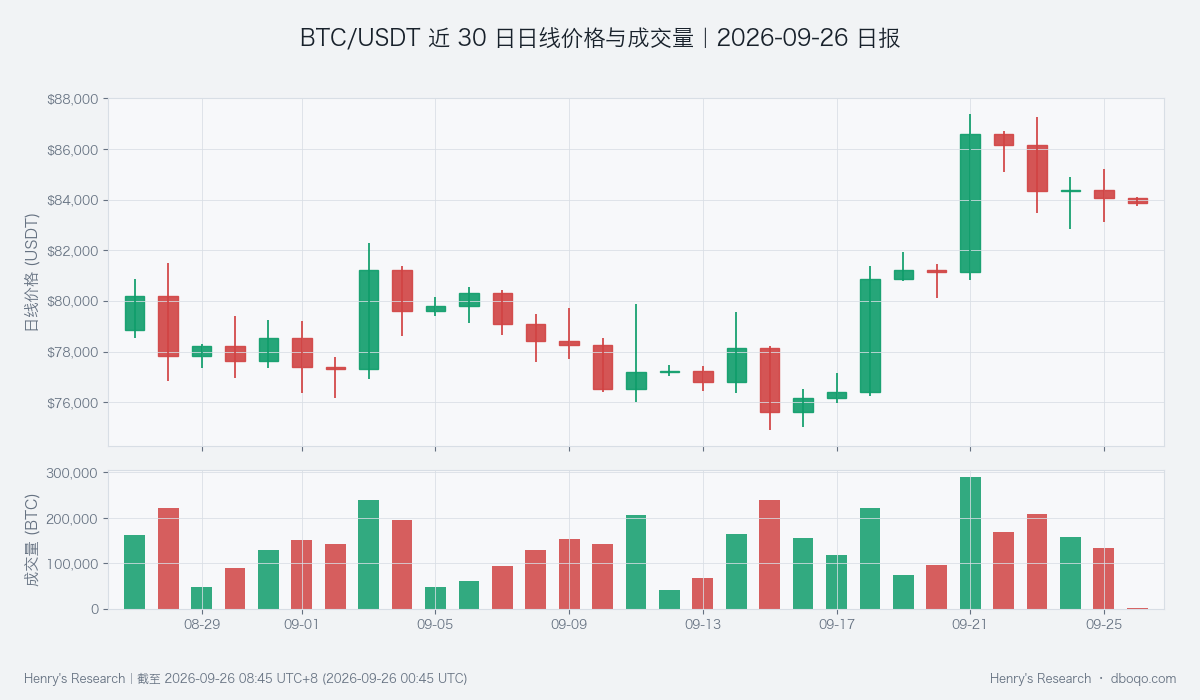
Daily prices and volume over the past 30 days. The final day is incomplete, so its smaller volume must not be interpreted as a completed day of lower turnover.
IV. Price-volume structure and range:Improving buying needs a breakout to prove itself
The recent trend in cumulative aggressive buying minus aggressive selling has turned positive, providing an important counterargument to the bearish view. However, the local improvement has not reversed the price decline. This indicator describes changes in trade aggressiveness, not new capital inflows. Its latest trend also does not mean that cumulative buying has overtaken selling across the entire observation period.
The past 24-hour range is 83,130.10 to 85,224.00 USDT. The lower boundary tests whether buying support persists, while the upper boundary tests whether a rebound can overcome existing resistance. Trading back and forth inside the range would preserve the possibility of sideways conditions. A decisive break above the upper boundary that holds on a pullback would be a stronger counterargument to the bearish view than a brief spike. A break below the lower boundary also needs volume and buying evidence to distinguish a temporary move from a sustained breakdown.
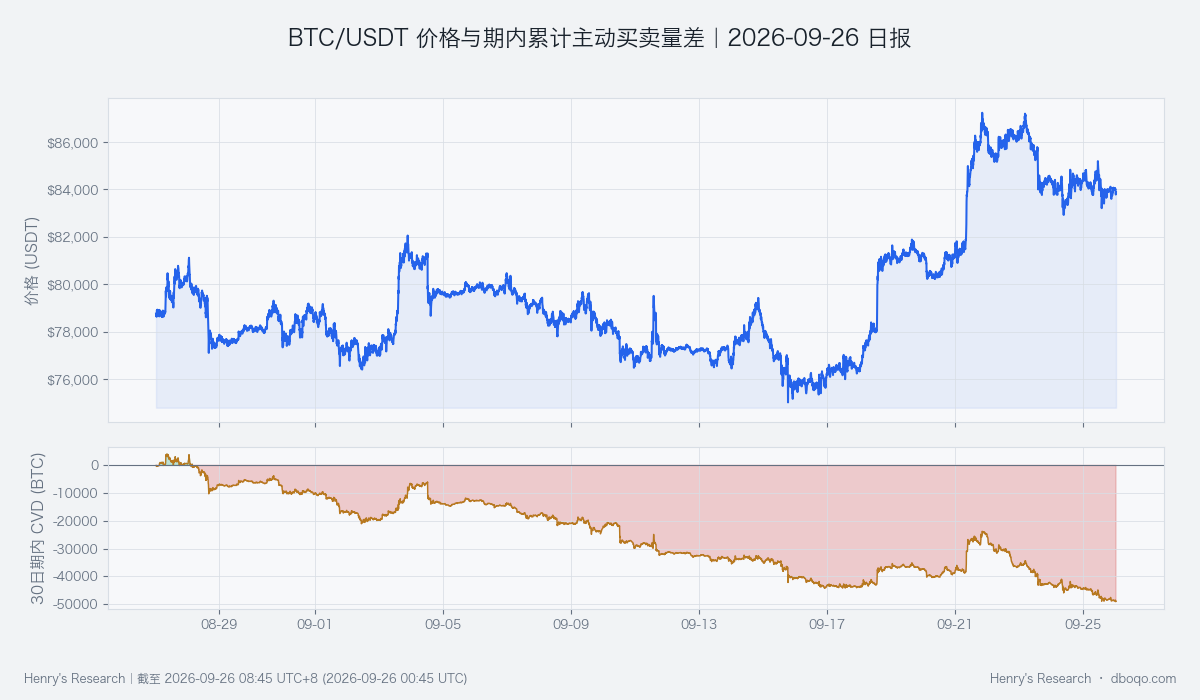
Price and cumulative aggressive buying minus aggressive selling over the past 30 days. The cumulative level across the period differs in meaning from the latest short-term trend.
V. Derivatives developments:Soft contract demand leaves rebound durability unconfirmed
The window average of the change indicator for outstanding contracts is -2.59%, versus a historical mean of +0.06%, lower than approximately 87% of comparable periods. This indicates soft derivatives participation and corroborates falling prices. It does not mean that total contracts declined by exactly that percentage over the full day, nor can this reading alone distinguish voluntary exits from forced closures.
Derivatives evidence therefore supports caution, but does not establish a chain of liquidations. If price rebounds while contract demand continues to contract, rebound durability would lack this layer of confirmation. If demand stabilizes alongside stronger aggressive buying, confidence in persistent short-term weakness should fall. The focus is on whether different pieces of evidence confirm one another, rather than assigning a direction to every derivatives indicator.
VI. Cross-market conditions and capital flows:Liquidity reserves expand, but overall conditions remain neutral
Stablecoin supply grew 1.13% over 7 days versus a historical mean of -0.06%. Approximately 2 of 180 comparable periods had higher readings, making this a rare high. It provides potential purchasing power and a meaningful counterweight to the bearish case. However, stablecoins may be used for settlement or remain outside the market; sustained subsequent buying is needed to establish their relevance to BTC demand.
ETF net inflows over the past 5 days total 22.51 hundred million US dollars, versus historical mean net inflows of 0.55 hundred million US dollars. Approximately 8 of 180 comparable periods were higher. Inflows remain strong, but this is a multi-day cumulative figure, not evidence of continuing acceleration in the latest period. The next test is whether fresh demand helps price recover the resistance area, rather than repeatedly counting existing inflows as new positive news.
BTC cross-market capital temperature is neutral. Stablecoin expansion provides support, but a stronger dollar is a constraint. ETF flows relative to their own recent pace are less impressive, while VIX, a measure of expected US equity volatility, does not provide a consistent signal of escalating risk. Large net inflows can coexist with neutral aggregate capital conditions. Stronger equity co-movement warrants closer attention to the external environment, but these relationships are conditional and do not establish deterministic causation.
VII. Combined signal and scenario tests:A short-term bearish view constrained by counterevidence
The combined signal is bearish, consistent with falling prices, weak short-term momentum and softer contract demand. It does not fully align with stablecoin expansion, ETF inflows and local improvement in aggressive buying. The conclusion therefore carries substantial uncertainty and should not be presented as unanimous bearish evidence. Neutral capital temperature also limits the case for a one-way decline.
The base case is a stalled rebound followed by another test of buying support inside the range. The adverse scenario is weakening external risk appetite alongside a break of the lower boundary. The opposite test is a break above the upper boundary jointly confirmed by volume, aggressive buying and contract demand. That combination would show capital support translating into price evidence and invalidate the present judgment. If evidence remains divided, range-bound trading should remain an accepted possibility pending the next comparable observation.
VIII. Risks
Historical comparisons describe relative position, not the probability of future gains or losses. Correlations can change quickly, multi-day capital indicators have timing differences, and price boundaries are not guaranteed to hold. Current evidence cannot determine the next direction of external markets. Unexpected news and liquidity changes may invalidate the short-term judgment; counterevidence should be tested continuously rather than treating rare readings as certain forecasts.
Disclaimer: This report was prepared by dboqo using market data as of 2026-09-26 08:45 UTC+8. Cryptocurrency markets are highly volatile. This report provides only an objective analysis of market phenomena and does not constitute investment advice. Investors must assess risks independently and exercise prudent judgment.