I. Core finding and direction: strong equity linkage, but low-volume gains need confirmation
Core finding: BTC's recovery has funding support but lacks confirmation from trading participation. Its unusually strong linkage with US equities suggests that changes in risk appetite may more readily coincide with moves in BTC; thin activity makes the durability of the advance questionable. Correlation does not determine direction, so gains in external markets cannot be equated with inevitable BTC gains.
Data scope: As of 2026-09-27 08:50 UTC+8, the observation covers the preceding 24 hours aligned to the cutoff, compared with 180 historical windows at the same cutoff. Daily funding data retain their original measurement periods and are not added into intraday flows. Historical comparison: BTC's correlation with US equities is +0.401 against a historical mean of +0.063; of 180 comparable periods, only about 1 was higher, an unusually elevated reading. Cross-market conditions therefore impose a stronger constraint on this recovery. Watch whether changes in external risk appetite are accompanied by responses in BTC volume and price.
Measurement review: The equity linkage is a statistical anomaly. Although volume is historically low, it does not meet this period's statistical anomaly threshold. Checks of units, frequency and scale found no potential measurement anomalies; low turnover should not be mistaken for a measurement error. Directional view: Conditionally bullish. Horizon: The next 24 hours. Conditions for validity: Price holds the lower range boundary, aggressive buying keeps improving, and turnover expands during a breakout above the upper boundary. Invalidation conditions: A high-volume break below the lower boundary, or fading external funding support alongside stronger selling, would overturn the recovery view.
II. Key market data: a modest gain conceals weak participation
BTC stands at 84,266.00 USDT, up +0.48% over 24 hours, versus a historical mean return of +0.15% on the same basis, higher than about 64% of comparable periods. This is slightly stronger than normal but does not establish accelerating momentum. The next test is whether broader trading supports the rise, rather than price simply drifting higher in quiet conditions.
Volume is only 35,199 BTC versus a historical mean of 150,353 BTC; of 180 comparable periods, only about 2 were as low or lower, an unusually subdued level. This is the most direct counterevidence to the bullish view: limited turnover can lift price but may not sustain it when selling emerges. Whether price keeps advancing as activity recovers is more informative than the gain alone.
III. Price action and trend: proximity to the range ceiling is not a breakout
The 24-hour range is 83,778.40 to 84,458.60 USDT. Price is near the upper boundary, leaving the recovery in a favorable position. These boundaries test whether buyers and sellers can maintain the current balance; they are not guaranteed support or resistance and are not return targets. A sustained break above the ceiling, followed by a successful retest, would strengthen the case for continued recovery.
The daily trend and intraday momentum are not fully aligned: the longer horizon retains an upward foundation, while the latest short-term momentum has not strengthened in tandem. The bullish view therefore describes a conditional recovery rather than confirmed broad acceleration. If price cannot leave the range, even continued modest gains should reduce confidence in trend extension until turnover and momentum confirm together.
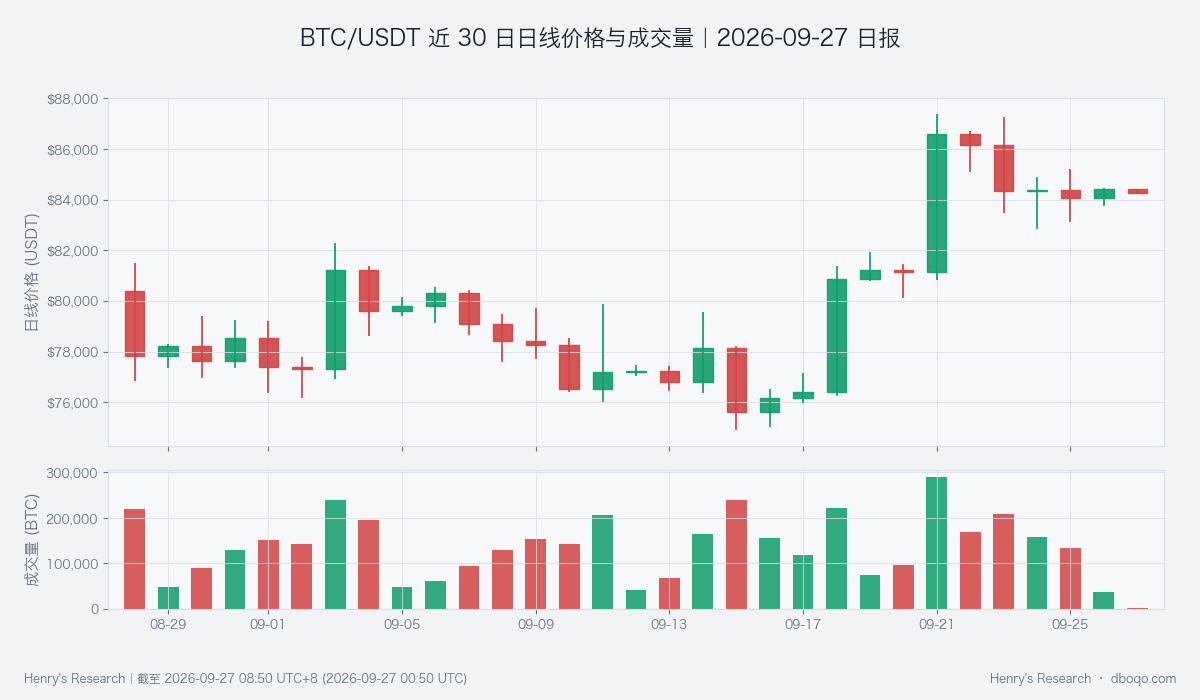
Price recovery needs follow-through in volume; the final daily candle is incomplete and cannot be compared directly with a full trading day.
IV. Price-volume structure and range: the buying advantage needs persistence
The cumulative trend in aggressive buying minus aggressive selling is slightly positive but remains in its historical normal range. It measures the balance of buyers and sellers willing to trade aggressively, not total fresh capital. The advance has mild buyer support, yet there is no strong buying evidence sufficient to remove concerns about thin turnover. A brief buying advantage should not be extrapolated into sustained demand.
Trading near the range ceiling provides a better test: improving buying, expanding turnover and shallower pullbacks together would strengthen the bullish case. If activity remains thin during an advance and aggressive selling then strengthens, the move remains unconfirmed. After a break below the floor, first assess whether selling persists rather than declaring a trend reversal on a single touch.
V. Derivatives developments: contracts offer no strong confirmation
Funding rates represent the holding cost transferred between perpetual-contract longs and shorts. The current window's average remains positive but below its historical mean; the futures basis, the contract's price difference from spot, remains negative. These measures do not jointly point to strong demand to chase the rise, so derivatives evidence cannot yet offset weak spot-market participation.
The open-interest change indicator is also slightly below normal. It cannot simply be read as a fresh bearish direction, and its average within the window must not be treated as the full-day change in aggregate contracts. Rising price accompanied by recovering contract participation and stronger spot turnover would make the recovery more convincing. Higher holding costs without turnover follow-through would instead raise concerns about inadequate buying support.
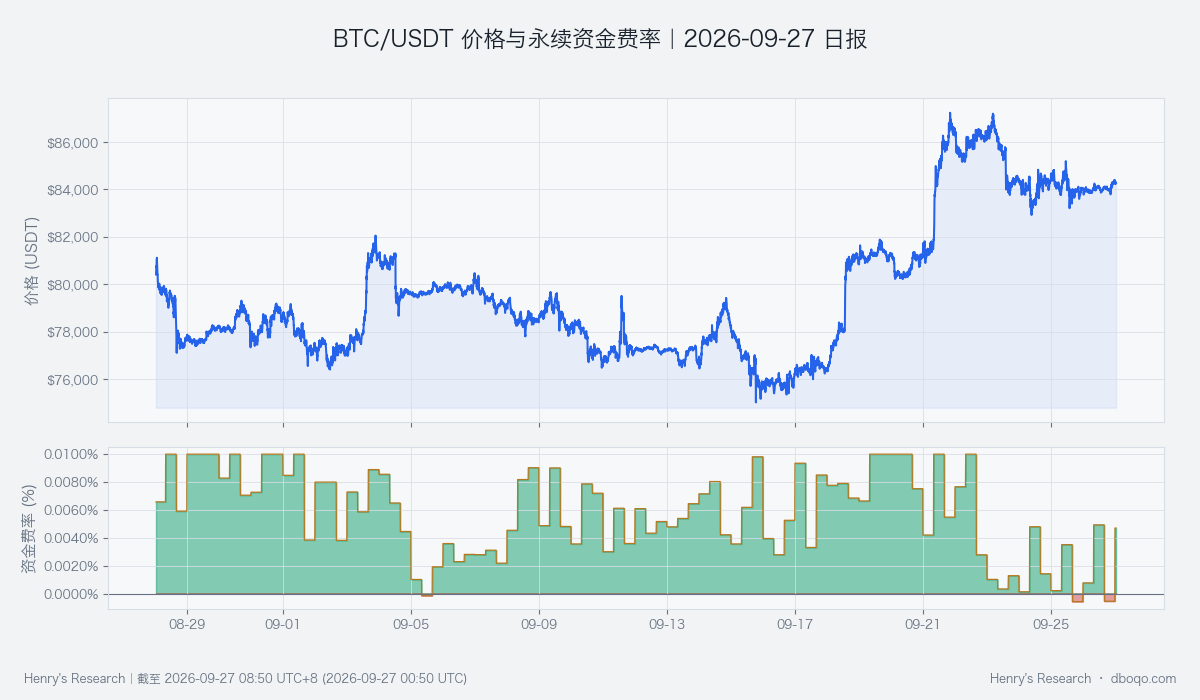
Funding rates describe holding costs. A positive reading does not establish sustained demand growth and must be assessed alongside price and turnover.
VI. Cross-market conditions and funding: support exists, but the overall temperature is neutral
ETF net inflows over 5 days are 15.21 hundred million US dollars against a historical mean net inflow of 0.72 hundred million US dollars, higher than about 89% of comparable periods. Recent capital absorption is stronger than usual, important counterevidence to concerns about thin turnover. This covers several days, however, and does not establish equally strong buying now. Watch whether inflows persist and translate into a breakout, rather than treating cumulative inflows as a short-term guarantee.
Stablecoin supply has grown +0.59% over 7 days versus a historical mean of -0.06%, higher than about 86% of comparable periods, indicating expanded potential liquidity. Stablecoins may remain outside trading, and fresh supply does not necessarily flow into BTC. BTC's cross-market funding temperature remains neutral: ETFs and stablecoins offer support, relative dollar pressure imposes a constraint, and volatility-risk factors do not provide uniform confirmation of hotter conditions. This combination allows recovery to continue but does not justify following the advance unconditionally.
VII. Composite signal and scenario validation: the bullish view needs price-volume delivery
The composite signal is bullish, consistent with the modest price rebound and funding support but at odds with thin turnover and weak short-term momentum. The base case is continued recovery supported by funding. Confirmation requires a breakout and retention of the upper boundary after turnover improves. If activity recovers but price stops advancing, the additional participation may also come from sellers, requiring a narrower bullish interpretation.
The opposing scenario is weaker external risk appetite, with BTC coming under simultaneous pressure amid its stronger equity linkage and breaking below the range floor on expanding volume. That would directly overturn the current view. If neither boundary breaks, the market is more likely to remain in a waiting phase; a view that has not been invalidated is not necessarily validated. All scenarios require joint observation of price, turnover and persistence of funding support, rather than substituting one indicator for the evidence as a whole.
VIII. Risks
Historical comparisons describe how unusual the current state is, not a certain probability of future outcomes. Correlations change, funding data have different frequencies, and low turnover may reflect the trading session. Unexpected events can quickly invalidate range boundaries. This conditional assessment applies only to the stated horizon and should be reconsidered when subsequent evidence changes.
Disclaimer: This report was prepared by dboqo using market data as of 2026-09-27 08:50 UTC+8. Cryptocurrency markets are highly volatile. This report is solely an objective analysis of market conditions and does not constitute investment advice. Investors must assess risks independently and make prudent decisions.