I. Core finding and direction:Stronger linkage has yet to become a directional trend
Core finding: BTC’s sensitivity to cross-market risk appetite deserves attention, but its own volume and price do not yet point consistently in one direction. Unusually strong linkage with US equities suggests external risk changes may transmit more readily. It does not predict the next move in equities or independently imply that BTC will rise. The more reasonable reading is that funding support coexists with short-term hesitation, with price yet to choose a direction.
Data scope: As of 2026-09-28 08:40 UTC+8, the current observation covers the preceding 24 hours aligned to the cutoff, compared with 180 historical windows at the same cutoff. Historical comparison: BTC’s correlation with US equities is +0.441 versus a historical mean of +0.064. Among 180 comparable periods, approximately 0 were higher, an unusually high reading. This signals greater cross-market transmission risk, but volume still needs to respond. Measurement review: No candidate anomalies in units, frequency or magnitude were identified. Correlation is a statistical outlier, not a monetary measure of capital inflows. Daily funding measures retain their original frequency and are not repeatedly added into intraday flows.
Directional assessment: Range-bound. Assessment horizon: The next 24 hours. Conditions: Price remains between the recent high and low, volume does not expand persistently, and the capital environment stays neutral. Invalidation: A breakout supported by sustained volume and aggressive buying, or a breakdown accompanied by expanding selling pressure. Either would require reassessing the range-bound view.
II. Key market data:Flat price and low volume jointly limit signal confidence
The latest price is 84,261.00 USDT, with a 24-hour change of -0.05%, near the historical middle and insufficient to establish a trend reversal. Volume over the same period is 72,649 BTC versus a historical mean of 149,575 BTC, lower than about 88% of comparable periods. With price almost unchanged, low volume points more to limited participation than to a decisive advantage for either bulls or bears. Watch whether volume expands as price leaves the consolidation range, rather than interpreting a small move as a trend.
This evidence also limits the interpretation of equity linkage: stronger correlation means more pronounced co-movement over a period, but does not compensate for limited participation in the current market. If cross-market prices move without a BTC volume response, effective transmission remains unconfirmed. A simultaneous price and volume response would make external developments more relevant to BTC’s own directional signal.
III. Price behavior and trend:The medium-term recovery survives, but extension needs confirmation
Price remains above the 10-day daily average of 83,758.71 USDT, suggesting the earlier recovery has not fully broken down. Holding an average and accelerating again are different propositions. Short-term hesitation makes this average a reference for observing demand after a pullback, rather than a level that guarantees a rebound. A loss of the average without recovery would weaken the medium-term case; a retest followed by improving volume would make the recovery more durable.
The daily chart provides background; volume from the latest unfinished calendar day is not compared directly with a completed day. The volume assessment in the text uses full observation windows aligned to the same cutoff, avoiding the mistake of treating an unfinished day as a sudden collapse in activity. The short-term view should change with price and volume together, and the daily background should not be extrapolated into a certain next-period outcome.
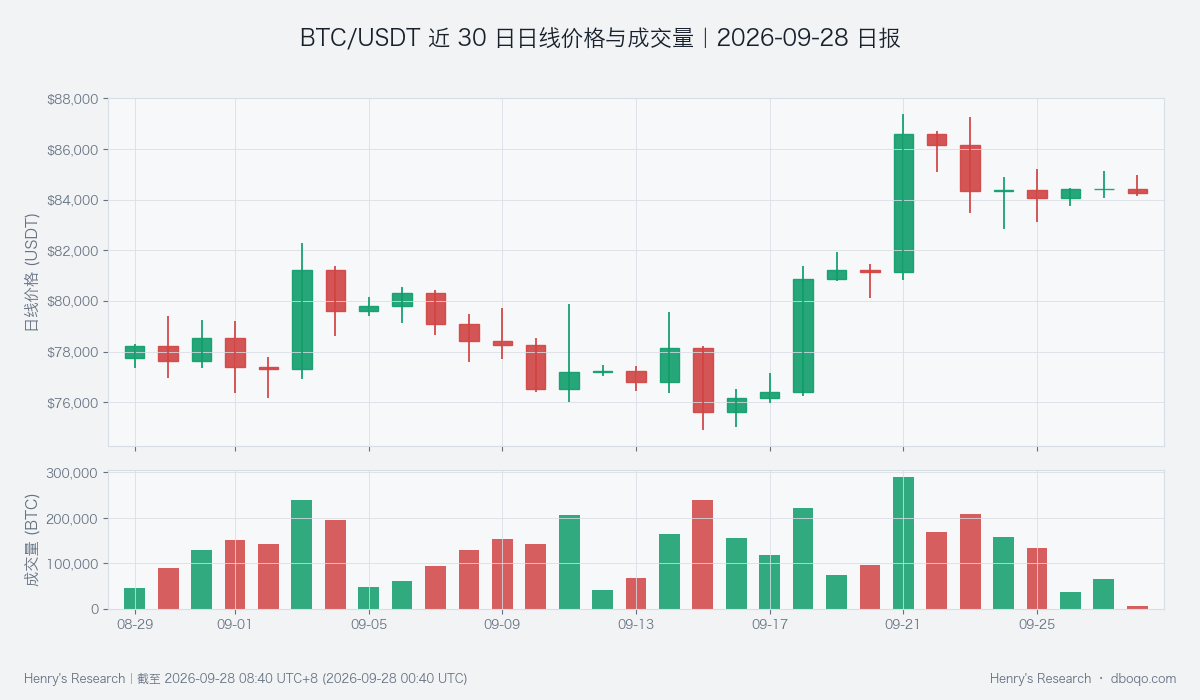
BTC/USDT daily price and volume over the past 30 days
IV. Price-volume structure and price range:Boundary confirmation matters more than fluctuations inside
The recent observation range is 84,074.30 to 85,146.40 USDT. The lower boundary tests whether demand holds, while the upper boundary tests whether fresh demand validates an advance. Neither is guaranteed support or a return target. With overall volume low, brief moves beyond these levels may reflect limited liquidity. The focus is whether price can stay beyond the boundary and whether aggressive buying minus aggressive selling continues in the same direction.
The cumulative aggressive buying-and-selling trend is slightly positive but close to its historical norm, insufficient to reject consolidation. An upside break without persistent buying may return to the range; a downside test without sustained selling also does not establish a new downtrend merely because of a momentary low. This is an important qualification to the range-bound assessment under low-volume conditions.
V. Derivatives developments:Contract costs show no strong directional consensus
The funding rate is a periodic payment between the long and short sides of perpetual contracts and helps assess willingness to pursue a direction. Its mean over the past 24 hours is +0.002316%, versus a historical mean of +0.003427%, lower than about 66% of comparable periods and somewhat below normal. The positive value means the long side still pays, but its relatively low level does not support strong enthusiasm for chasing gains or automatically imply a bearish view. Watch whether funding and volume change together when price breaks out.
Derivatives offer no new evidence strong enough to override the tension in spot price and volume. Rising costs while price remains capped would instead raise concern that willingness to chase gains is detached from actual demand. Price extension with improving volume would provide a better basis for greater trend confidence. The historical funding chart supplies context for this relationship, not an independent forecast of direction.
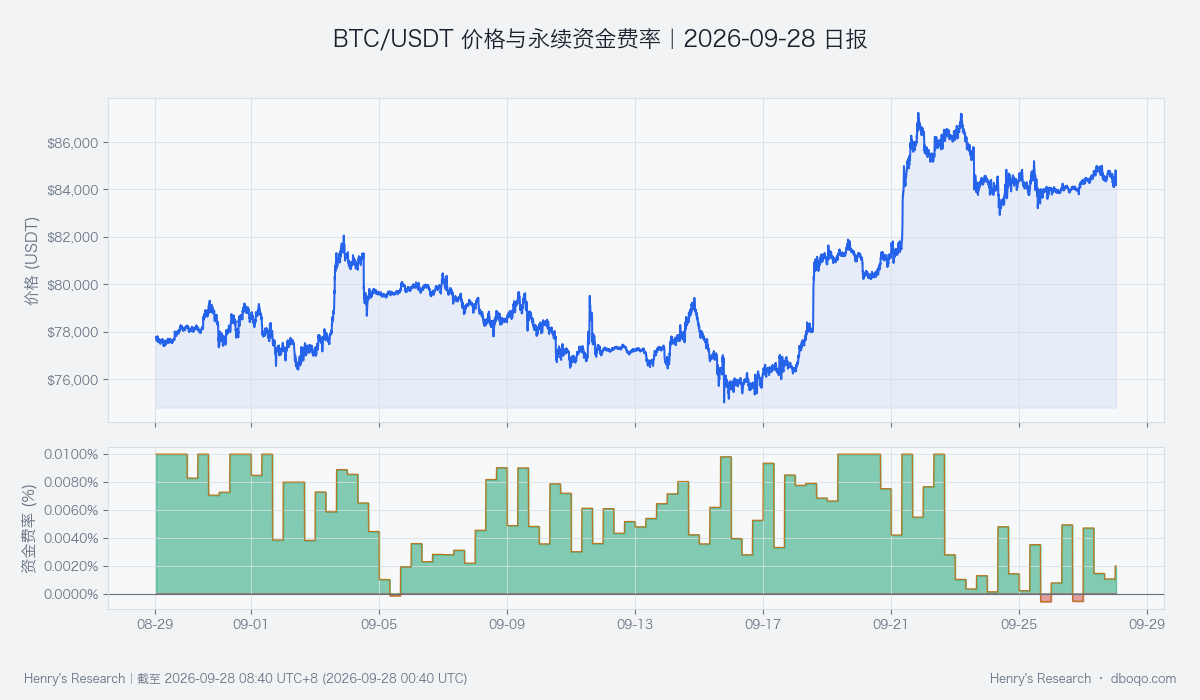
BTC/USDT price and perpetual funding rate over the past 30 days
VI. Cross-market conditions and capital:Dollar pressure partly offsets funding support
BTC cross-market capital temperature is neutral. ETFs still show net inflows over the past 5 days and stablecoin supply is expanding, indicating that the potential funding environment has not broadly deteriorated. Stablecoin expansion does not mean that capital has already purchased BTC. The 7-day stablecoin growth rate is +0.59%, versus a historical mean of -0.05%, higher than about 86% of comparable periods. This argues against prematurely adopting a one-sided bearish view, but still needs to translate into more persistent volume and price support.
A relatively strong dollar is a constraint, while VIX, which reflects expected US equity volatility, does not indicate pronounced stress. These factors offset one another, leaving the overall reading neutral. Alongside unusually strong equity linkage, watch both external risk changes and BTC’s own volume response. Capital temperature is neither a monetary measure of direct BTC inflows nor proof of causality. Easing dollar pressure without improving volume would still be insufficient to confirm an uptrend.
VII. Combined signal and scenario validation:The range-bound view needs joint price, volume and funding tests
The combined signal is range-bound, broadly consistent with low volume, stagnant price and neutral capital temperature. The medium-term recovery and funding expansion provide support, while short-term hesitation limits confidence in further upside. There is insufficient evidence to treat either side as a persistent trend. Strong equity linkage increases sensitivity to changing scenarios, not certainty about direction.
The base case is repeated movement inside the range. The upside case requires a sustained move above the upper boundary, improving volume and persistent aggressive buying. The downside case requires a loss of the lower boundary, sustained selling pressure and weaker funding support. These developments would invalidate the current view. If only correlation or a single funding measure changes without a price and volume response, uncertainty should remain explicit.
VIII. Risks
Comparable historical windows include different market environments; historical ranking is not the probability of a future event. Cross-market correlation can change quickly, and funding measures may respond at a different time from trading activity. Low-volume periods require particular caution about brief breakouts and rapid reversals, while unexpected events may render the observation range irrelevant. This assessment applies only to the stated horizon and does not extend to a long-term conclusion.
Disclaimer: This report was prepared by dboqo using market data as of 2026-09-28 08:40 UTC+8. Cryptocurrency markets are highly volatile. This report provides objective analysis of market conditions only and does not constitute investment advice. Investors must independently assess risks and make prudent decisions.