Yesterday, BTC almost recovered from an intraday low as buyers briefly stepped in. Over the past 24 hours it fell 0.90% to 80,036.60 USDT, while volume shrank to roughly half its usual level. Growth in the 30-day stablecoin supply fell further to a rare low, and yesterday's support did not develop into sustained buying. The view for the next 24 hours is bearish. A brief rebound remains possible, but it would need broader trading and persistent buying to change the picture.
Price turns down again, with thin trading weakening the case for a rebound
BTC reached 80,999.90 USDT and touched 79,809.20 USDT over the past 24 hours, ending near the lower end of that range. Yesterday's recovery from a deeper low did not carry forward, showing how fragile the support remains. The latest price is below the 10-day average of 81,755.29 USDT, a guide to where recent trades have cleared. Until that level is regained, one intraday bounce is weak evidence of a broader repair.
Volume was 72,752 BTC, against a historical mean of 146,245 BTC, lower than about 86% of the 180 comparable periods ending at the same hour. Trading at roughly half the usual level does not justify calling today's decline a broad selloff, but it also leaves a rebound short of participation. The key price-and-volume change is that yesterday's partial recovery already came on light trading; today trading fell further and price weakened again. If volume grows yet price still cannot recover the short-term average, the bearish view would gain support.
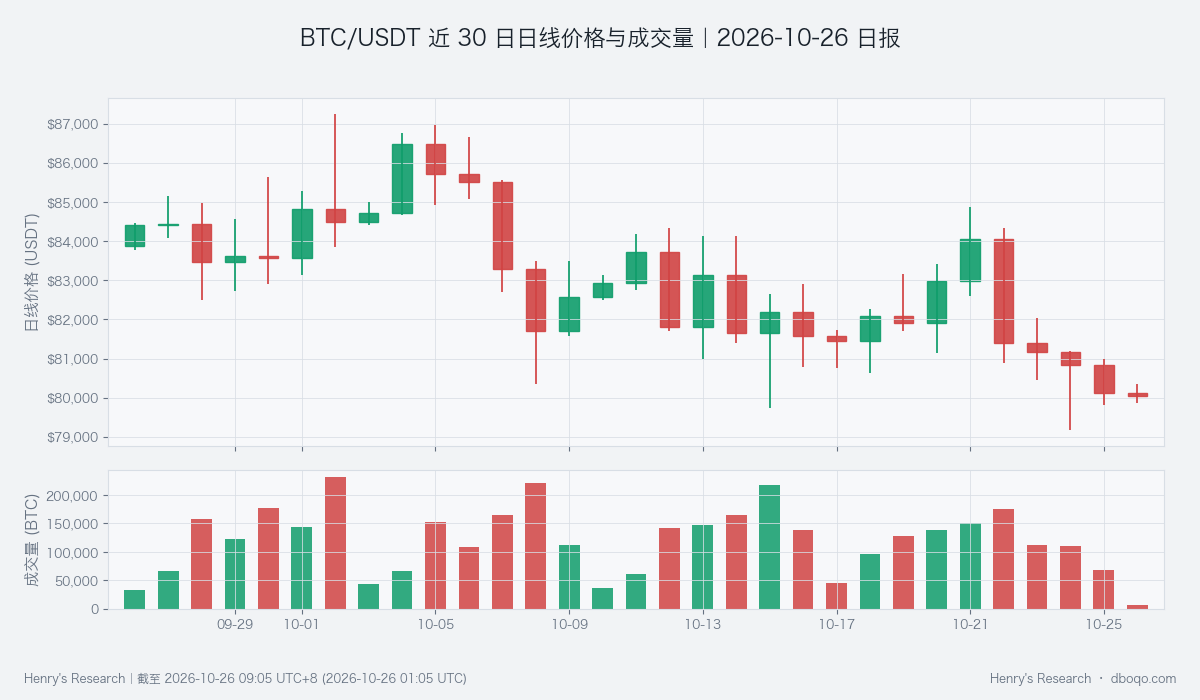
Price fell over the past 24 hours while volume remained below its historical norm.
Brief buying improves, but the broader funding backdrop stays cool
The recent change in active buys minus active sells remains positive at 31 BTC. That shows buyers have not disappeared during the decline and is a counterpoint to the bearish view. It is weaker, however, than yesterday's positive 104 BTC. Full-day net buying strength was so low that only about 13 of 180 comparable periods were equally weak or weaker. A short-lived improvement has not become a full-day advantage, so a positive reading alone cannot establish that selling pressure has ended.
The 30-day stablecoin supply growth rate stands at negative 2.30%, against a historical mean of negative 0.41%; only about 7 of 180 comparable periods were as low or lower. ETFs recorded a net outflow of 5.24 hundred million US dollars over five days, deeper than yesterday's 3.63 hundred million US dollars. These slower-moving funding measures cannot explain every intraday move. Together with thin trading and weak buying, though, they show that a recovery still lacks firm support. The composite signal is bearish, in line with price and funding evidence.
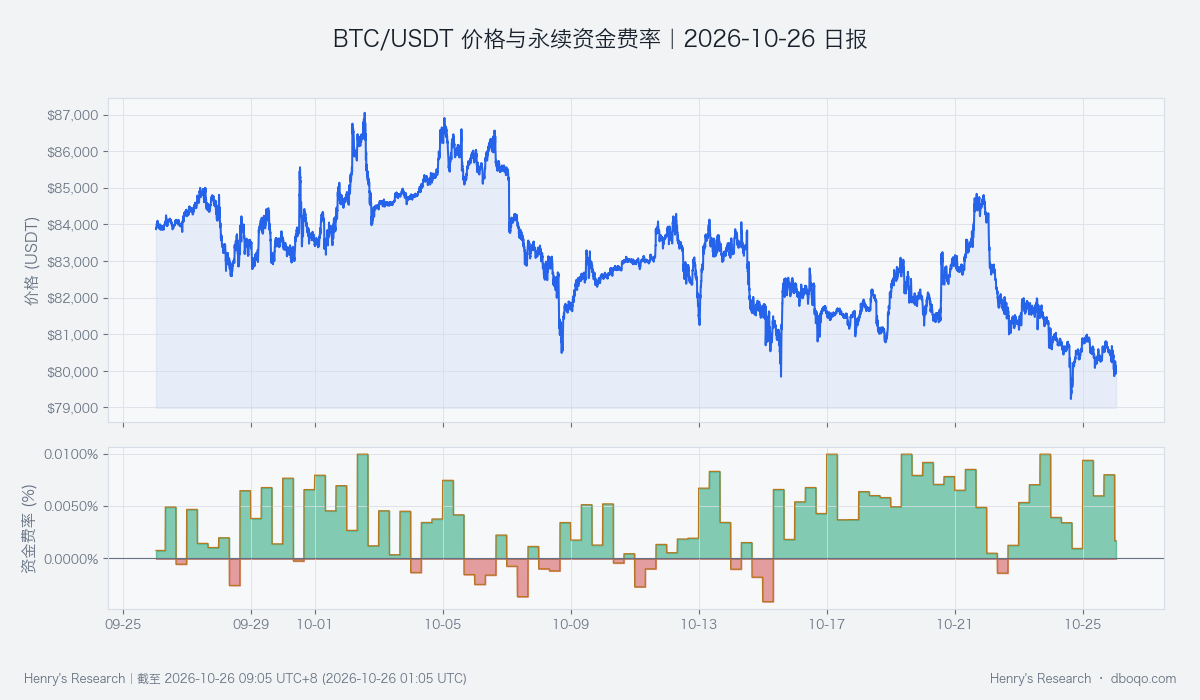
The next test is whether stronger trading can improve the weak price action.
Watch the low first, then the short-term average
If price falls below 79,809.20 USDT while active selling keeps the lead, yesterday's signs of support would weaken further. Conversely, if price regains the area around the 10-day average of 81,755.29 USDT on higher volume and active buying keeps improving, the current bearish view would need reassessment. What matters is whether price and participation improve together, rather than one brief crossing of a level.
Data note: As of 2026-10-26 09:05 UTC+8, price and volume cover the past 24 hours. Historical comparisons use 180 comparable periods ending at the same hour; funding measures retain their own observation windows.
Disclaimer: This report was prepared by dboqo using market data as of 2026-10-26 09:05 UTC+8. Cryptocurrency markets are highly volatile. This report is an objective analysis of market conditions and does not constitute investment advice. Investors should assess risks independently and act with care.