The long-short imbalance rose, but the midweek rally did not hold
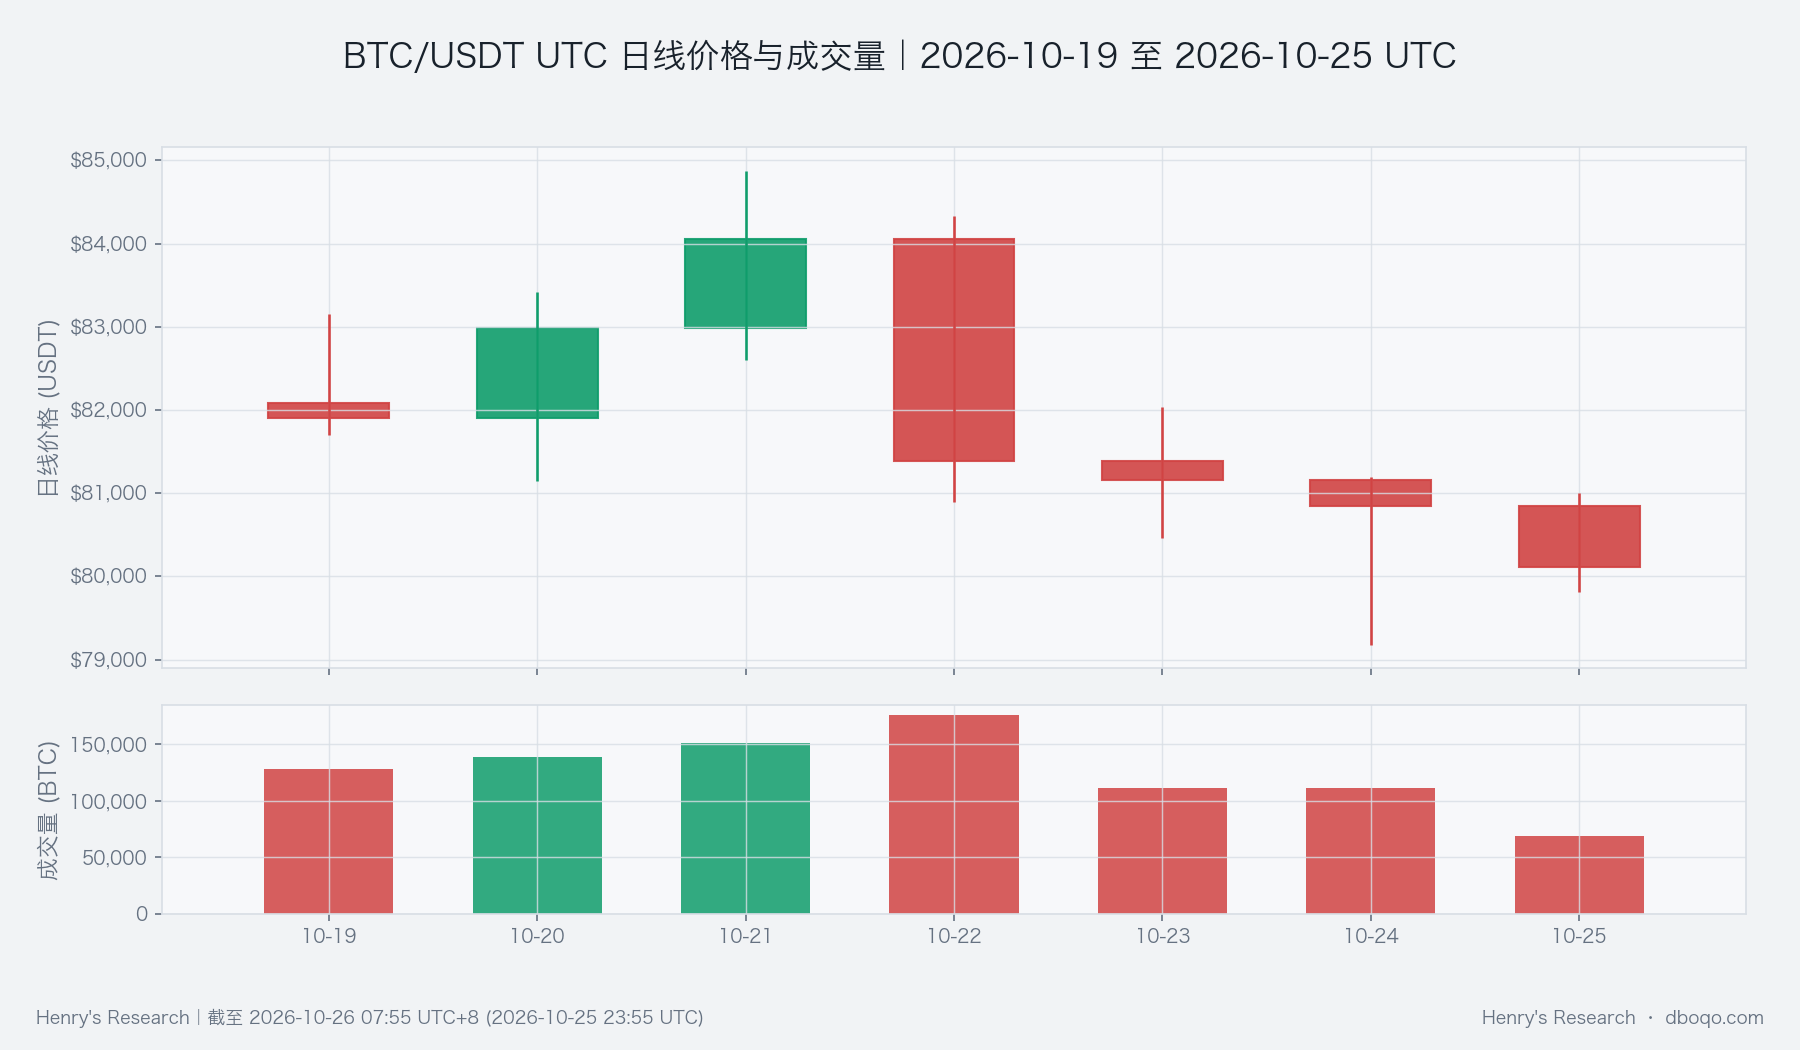
BTC rose early in the week and then fell. It reached 84,875.20 USDT on Wednesday before closing at 80,114.30 USDT, down 2.39% from the start of the week. The long-short ratio was unusually high, yet it did not sustain the advance: bullish positioning was evident, but prices turned lower on Thursday. Our view for next week is bearish. The key question is whether a rebound can regain its footing with sustained buying, rather than where the next low might be.
BTC opened at 82,077.90 USDT and rose through the first three days, closing Wednesday at 84,050.00 USDT. It fell to 81,384.60 USDT on Thursday, when volume reached 176,120 BTC, the highest daily total of the week. It ended the week at 80,114.30 USDT. The midweek peak alone suggests strength; price and volume together tell a less convincing story, since the busiest session came during the retreat. Weekly volume was 885,471 BTC, below the historical mean of 1,213,534 BTC and below roughly 80% of comparable weeks. The early rise lacked broad participation, while the later decline erased it.
Active selling and tighter funding make a rebound harder to confirm
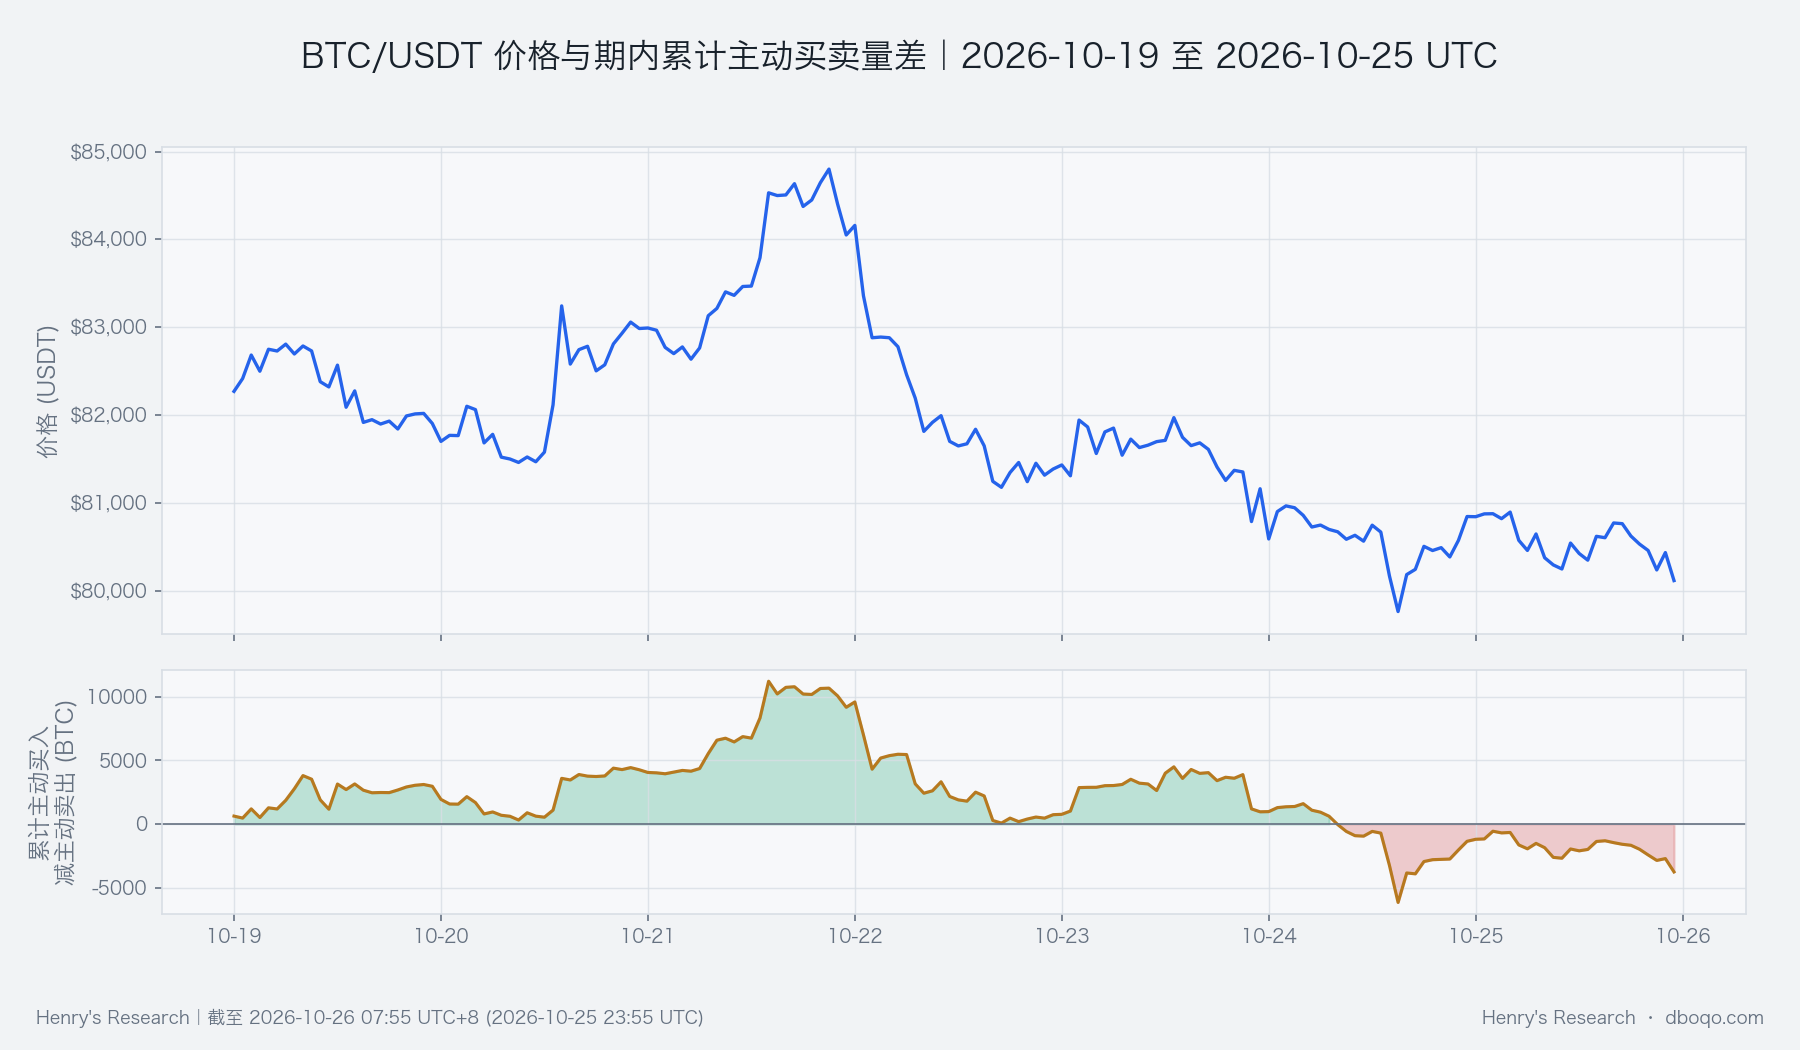
As prices fell, the latest measure of active buying minus active selling was negative 32 BTC, against a historical mean of positive 2 BTC. It was weaker than about 81% of comparable weeks. This does not mean every trade was a sale; it means active buying had yet to establish a lasting advantage by week-end. The chart shows prices weakening in the latter half of the week without a clear reversal in the buying balance. A brief price rebound with this balance still weak would be unconvincing.
The broader funding backdrop was also tight. Seven-day stablecoin supply growth was negative 0.75%, versus a historical mean of positive 0.49%; among 104 comparable weeks, only about 4 were as low or lower. The 30-day rate was also negative 1.78%, so the weakness was not confined to one short window. Stablecoin supply changes slowly and cannot explain a single day's move, but this backdrop reduces confidence that a rally will attract fresh capital. ETFs recorded net outflows of 3.63 hundred million dollars over the latest five days. This is another lagged funding signal, and it points in the same cautious direction.
An elevated long-short ratio is the counterargument, and a source of risk
The market was not uniformly bearish. The latest long-short ratio was 2.17, and its deviation was unusually high: among 104 comparable weeks, only about 8 were higher. That is real bullish intent and the strongest counterargument to our view. If it turns into sustained buying, prices could recover. But elevated positioning did not keep this week's rally intact; intent is not the same as executed demand. External risk sentiment was also weak. VIX, a gauge of expected US equity volatility, was higher than in about 89% of comparable weeks. This is a lagged cross-market condition, not a proven cause of BTC's decline.
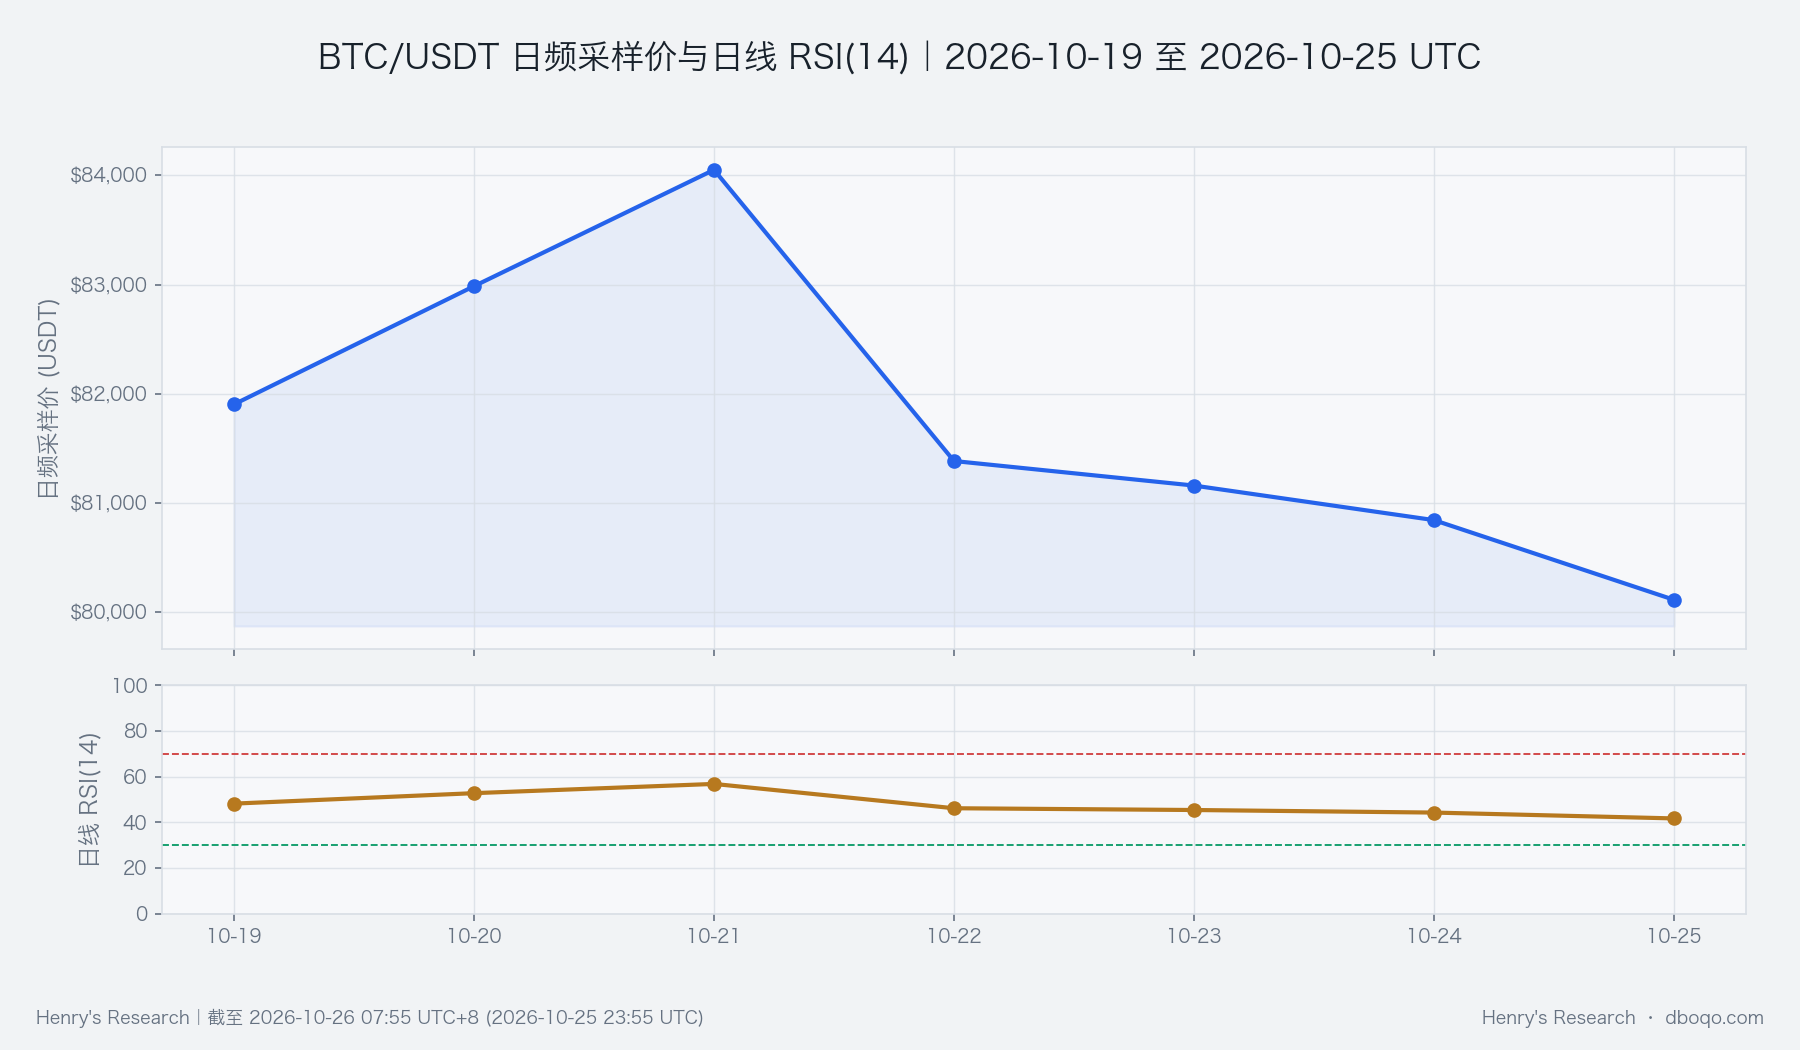
The daily strength indicator did not improve enough by week-end to offset the decline, consistent with a close below the midweek peak. The combined signal, price and volume, and funding evidence all lean weaker. They support a conditional bearish view for next week, not a prediction of the size or timing of a fall. Last week the question was whether a rebound from a low could hold. This week, an upward test failed during a busier selloff; the opposing evidence is now elevated bullish positioning. The market remains divided.
Next week, watch whether a rebound regains lost ground
First, watch whether price can reclaim Thursday's close near 81,384.60 USDT while higher volume is accompanied by sustained active buying. If both occur, the bearish view needs reassessment. Also watch this week's low of 79,178.60 USDT. A renewed break below it with heavier selling would suggest that support near the weekend low was insufficient. These are observation points, not return targets. If price stays between them without better funding evidence, caution is more warranted than declaring a new trend.
Data note:This report covers the complete UTC week from 2026-10-19 00:00 to 10-26 00:00; data run through 10-25 23:55 UTC. Historical comparisons use 104 complete comparable weeks. Daily funding and cross-market observations may lag prices.
Disclaimer:This report was prepared by dboqo using market data through 2026-10-26 07:55 UTC+8. Cryptocurrency markets are highly volatile. This report is an objective analysis of market conditions and does not constitute investment advice. Investors should assess risk independently and make decisions with care.