I. Key Finding and Direction This Week: Price Rose, but Participation Fell to a Historical Low
Data scope:This report covers the complete market cycle from 2026-08-03 08:00 to 2026-08-10 08:00 Beijing time and compares this week's indicators with the previous 104 complete comparable weeks. The text and charts use the same cycle boundaries and statistical methodology.
Key finding:BTC closed the week up 2.07%, but trading volume ranked only in the historical 2% percentile, while realized volatility fell further to the 1% percentile. This is the week's most important contradiction: price recovered, but broad participation and trend momentum did not keep pace. The week's advance is therefore better understood as a recovery in a low-liquidity environment than as a new trend that has already gained broad market confirmation.
Historical comparison:The weekly price gain exceeded the historical mean of 0.27% and ranked in the 66% percentile, so it was not an extreme advance. Trading volume, however, was only 724,969 BTC, significantly below the historical mean of 1,299,539 BTC and in the 2% percentile. Realized volatility was 0.07%, versus a historical mean of 0.13%, ranking only in the 1% percentile. Compared with the price gain, the latter two indicators provide stronger evidence that the rebound's sustainability remains unconfirmed.
Methodology review:This week contained exactly 2,016 5-minute intervals. All values are comparable with the historical sample of complete weeks, and no anomalies were found in units, aggregation frequency, or magnitude. The current deviations are treated as genuine market phenomena, with no questionable methodological factors included in the directional assessment.
Directional assessment:The overall assessment for the next calendar week isbearish. The price increase and some aggressive buying are counterevidence, but trading volume, trend momentum, the price's position within its range, and stablecoin supply point more strongly to a weak foundation for the rebound. This assessment is a conditional baseline scenario, not a prediction of the price path on every day next week.
Assessment horizon:The next calendar week.Conditions for validity:Price fails to break decisively above 65,482.70 USDT, trading volume remains at a historical low, and neither RSI nor stablecoin supply improves materially.Invalidation conditions:If price holds above 65,482.70 USDT on higher volume, while aggressive buying expands and lifts weekly momentum, the baseline scenario should be revised to neutral or bullish.
II. Historical Means and Extreme Percentiles: Low Volatility and Low Volume Defined the Week
The truly extreme historical readings this week were not the 2.07% price gain, but realized volatility in the 1% percentile and trading volume in the 2% percentile. Their simultaneous occurrence indicates that the advance took place in an environment of exceptionally low trading activity. This structure does not negate the gain; it warns that if volume does not normalize next week, even modest new selling could quickly disrupt the rebound. Conversely, if price remains above this week's high after volume expands, low volume would merely be an early-stage characteristic of the rebound rather than a trend weakness. The main information next week will therefore come from the direction price takes after volume returns, not from this week's 2.07% gain itself.
III. Price Action and Trend: Weekly Close Higher, but Short-Term Momentum Remains Weak
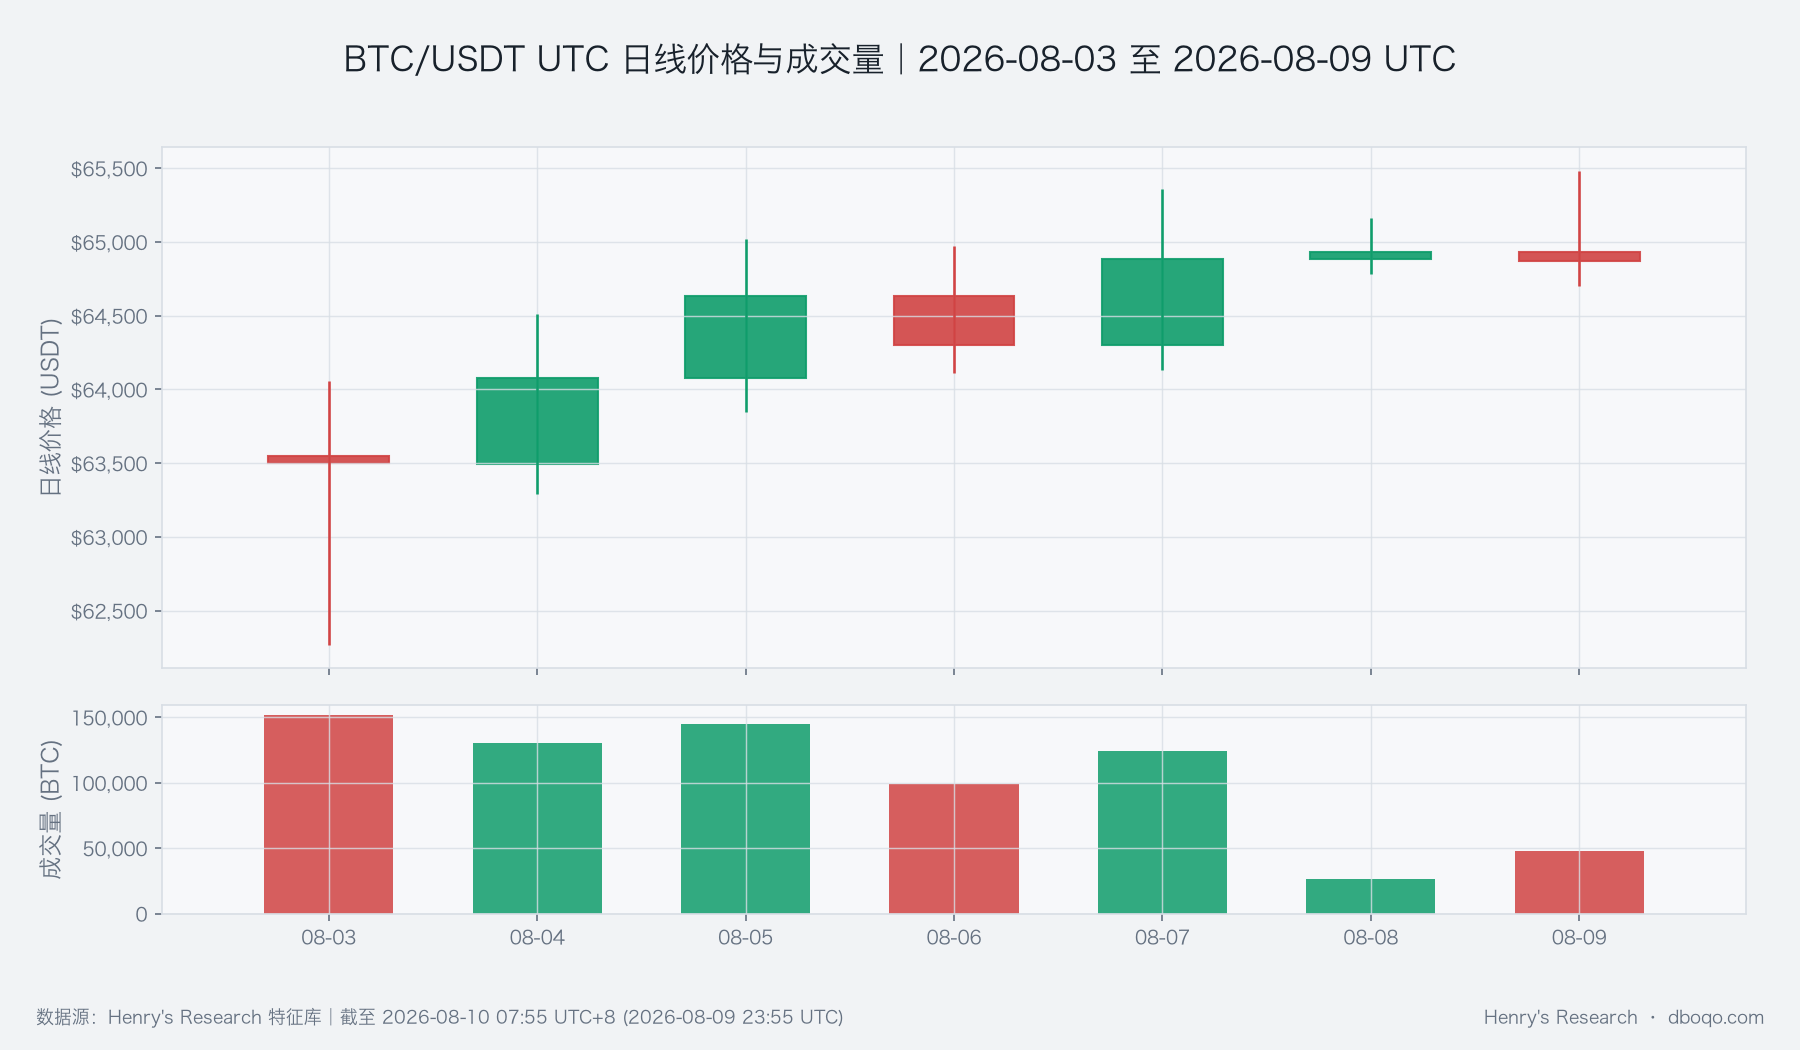
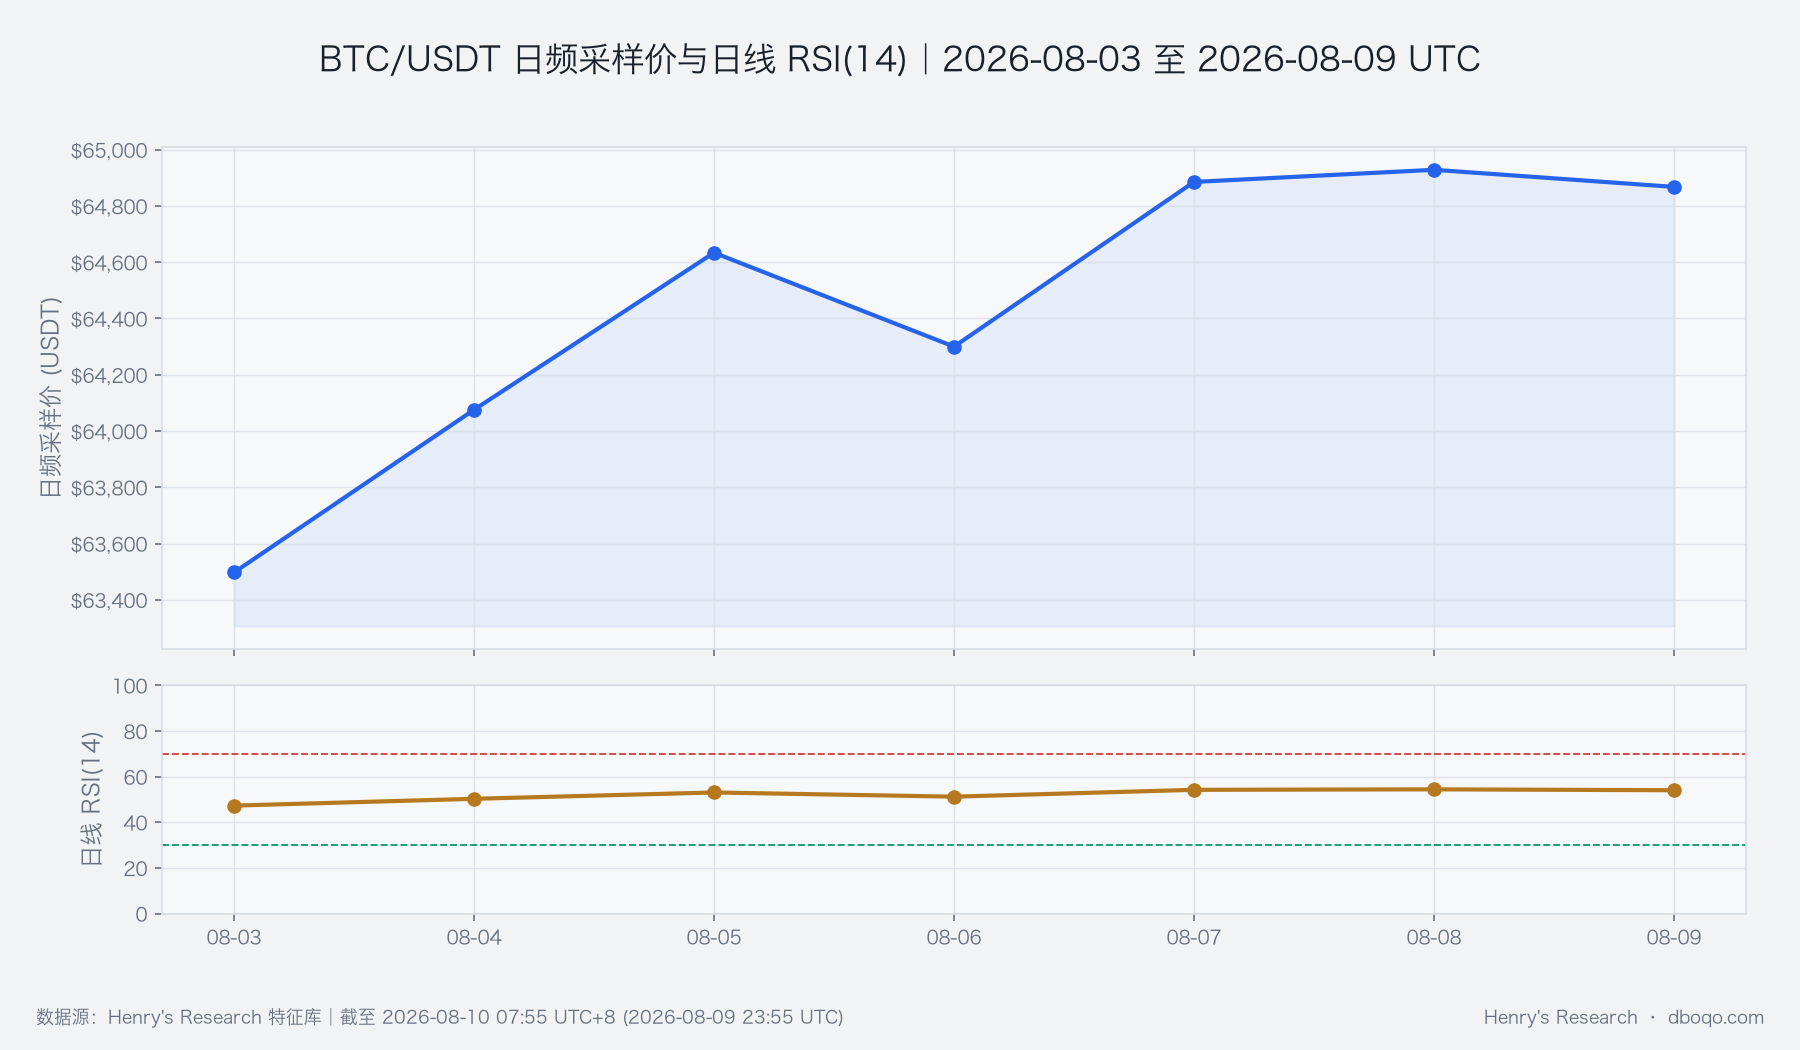
BTC rose from 63,550.00 USDT to 64,867.80 USDT this week, reaching a high of 65,482.70 USDT and a low of 62,268.20 USDT. RSI, however, was only 36.84, significantly below its historical mean of 50.86 and in the 14% percentile. The price's position relative to its recent norm was also in the 13% percentile. This means the weekly recovery has not yet brought the short-term trend back into neutral territory. If price rises next week without an improvement in RSI, the advance will look more like an extension within a weak range than a trend reversal. Notably, this week's close remained approximately 615 USDT below the high, indicating that overhead supply has not been fully absorbed. A renewed test of the high next week will distinguish a weak recovery from the start of a trend more effectively than this week's positive close alone.
IV. Price-Volume Structure and Fibonacci: Localized Buying Improved, but Overall Demand Remained Insufficient
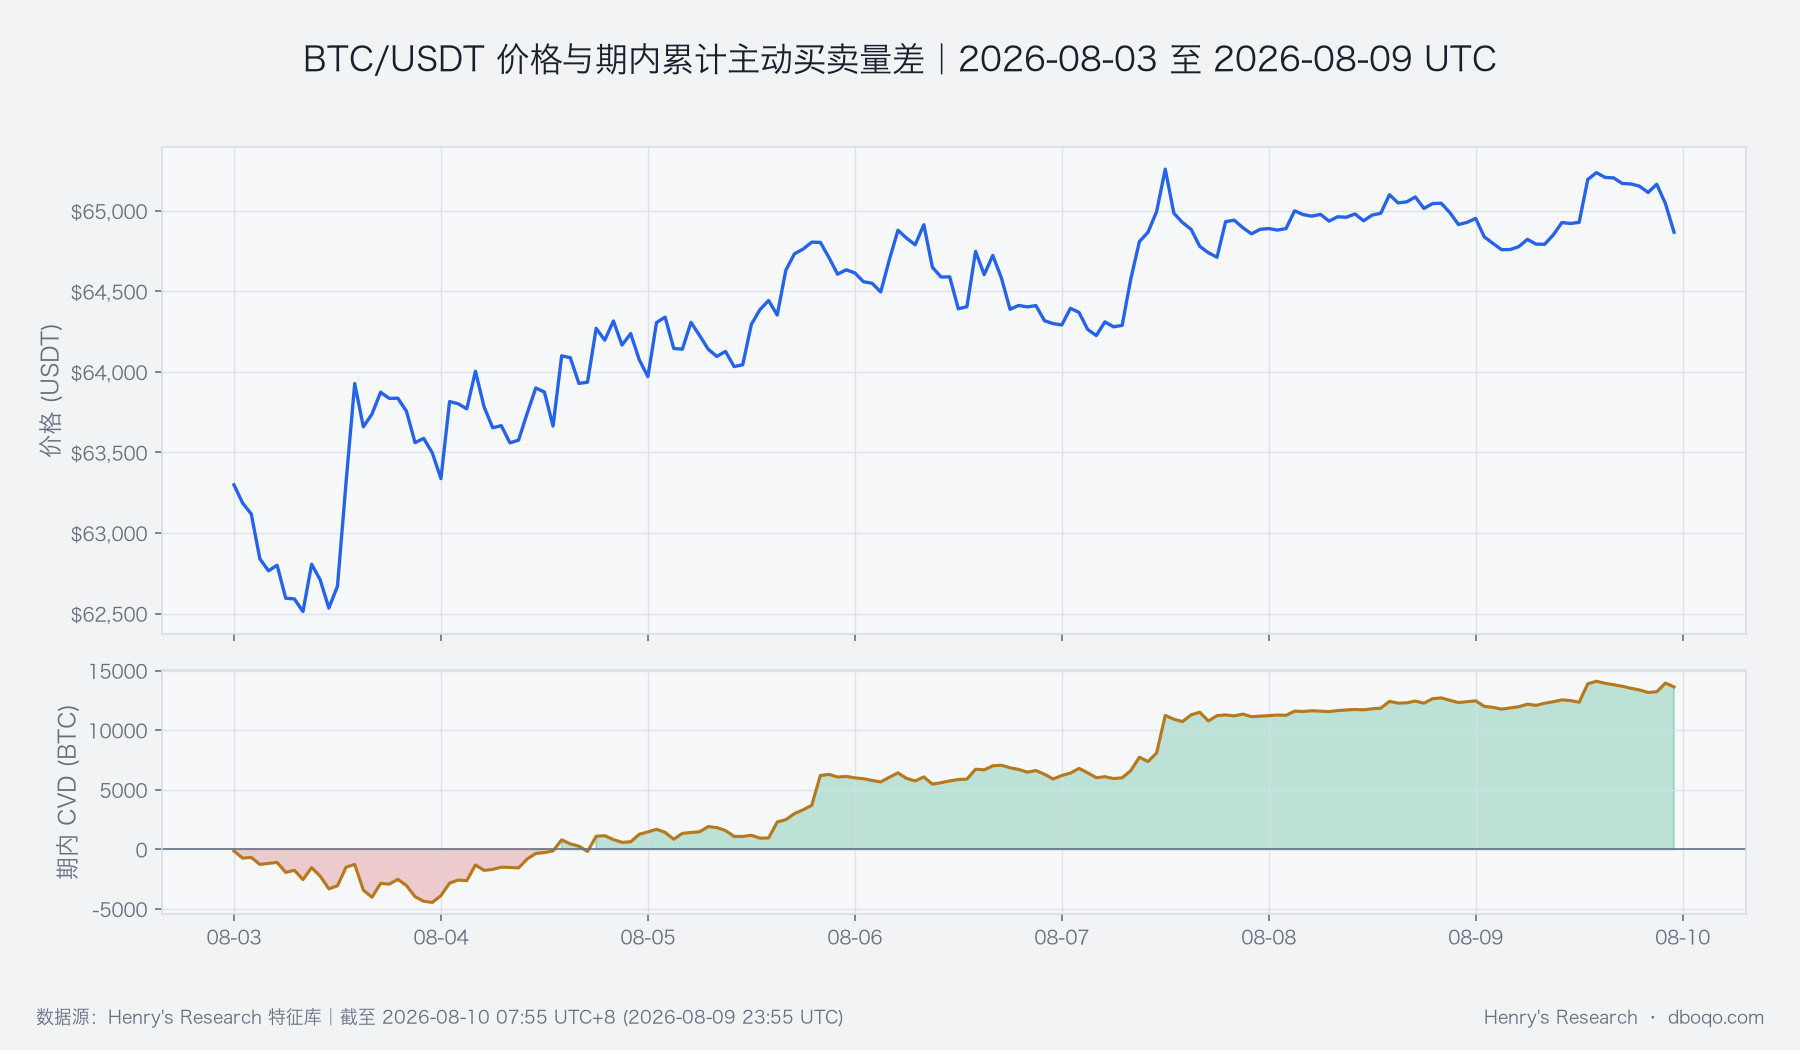
The cumulative direction of aggressive buying and selling was above its historical mean and ranked in the 70% percentile, showing that the rebound was not entirely unsupported by buying. However, aggressive net-buying intensity was only near the historical median, while total trading volume ranked in the 2% percentile. This suggests that the improvement was driven more by localized buying and did not develop into broad capital participation. Price ranked only in the 12% percentile within its recent swing range, further indicating that the rebound remained in the lower part of the range.
V. Derivatives Anomalies: Contract Market Positioning Was Neutral, but Volatility Pricing Increased
Funding rates and the spot-futures basis were both near their respective historical medians, while open-interest changes showed no extreme expansion. Derivatives therefore provided no clear confirmation of a one-sided trend. However, the implied-realized volatility spread was 6.82, above its historical mean of 2.21 and in the 72% percentile. Combined with realized volatility ranking only in the 1% percentile, this indicates that the derivatives market does not fully trust the current calm. A rapid directional move should be considered possible when volume returns next week. If funding remains moderate and the spot-futures basis improves during a price breakout, the advance would not appear to be driven by excessive speculation. If funding rises rapidly while price does not advance, a reversal of crowded positioning should be monitored.
VI. Cross-Market and Funding Conditions: ETFs Provided Support, While Stablecoin Supply Weakened Broader Alignment
BTC cross-market capital conditionswere neutral (+0.20). Net ETF inflows over the past 5 days totaled 7.97 hundred million US dollars, above the historical mean of 3.27 hundred million US dollars and in the 70% percentile. The VIX environment ranked in the historical 7% percentile and was also relatively favorable for risk assets. However, stablecoin supply declined by 0.79% over 30 days, in clear contrast with the historical mean increase of 2.43%, and ranked only in the 14% percentile. This means external funding conditions improved, but crypto-native liquidity did not follow, leaving overall conditions neutral.
VII. Composite Signal and Next-Week Scenarios: Bearish Baseline, but a High-Volume Breakout Would Quickly Change the Conclusion
The composite signal is currently bearish, consistent with evidence from low trading volume, weak momentum, the price's position in the lower part of its range, and contracting stablecoin supply. However, the weekly gain, improved aggressive buying direction, and ETF inflows provide material counterevidence, making a one-sided decline an inappropriate framework for next week. The baseline scenario is repeated trading below the upper boundary, followed by renewed weakness if volume remains insufficient. The alternative scenario is a high-volume break above 65,482.70 USDT, accompanied by improving momentum and internal liquidity. Monitoring should follow this order of priority: first, whether volume leaves its historically extreme low range; second, whether price can hold above this week's high; and finally, whether RSI and stablecoin supply recover together. Only if all three occur in sequence will the rebound advance from a price phenomenon to evidence of a trend.
VIII. Risk Disclosure: Do Not Treat a Low-Volume Advance or ETF Inflows as a Standalone Answer
The greatest interpretive risk this week is focusing only on the 2.07% gain while ignoring historically low trading volume, or focusing only on ETF inflows while ignoring the contraction in stablecoin supply. The former may overstate the breadth of the trend, while the latter may overstate overall capital alignment. In addition, realized volatility in the 1% percentile does not mean that risk will be low next week. On the contrary, with derivatives already pricing higher future volatility, any high-volume breakout or breakdown could unfold more rapidly.
Disclaimer:This report was prepared by dboqo based on market data available through 2026-08-10 07:55 UTC+8. Cryptocurrency markets are highly volatile. This report provides only an objective analysis of market conditions anddoes not constitute investment advice. Investors must assess risks independently and make prudent decisions.