I. Market Overview
Data scope: As of 2026年7月30日08:55(UTC+8), BTC/USDT was quoted at 63,673.70 USDT, down 0.40% over the past 24 hours, with a range of 63,234.00 to 64,715.90 USDT and volume of 180,479 BTC. After rising, the price returned to the lower part of the range, indicating unstable buying support above 64,000, although the intraday low has not yet been persistently lost.
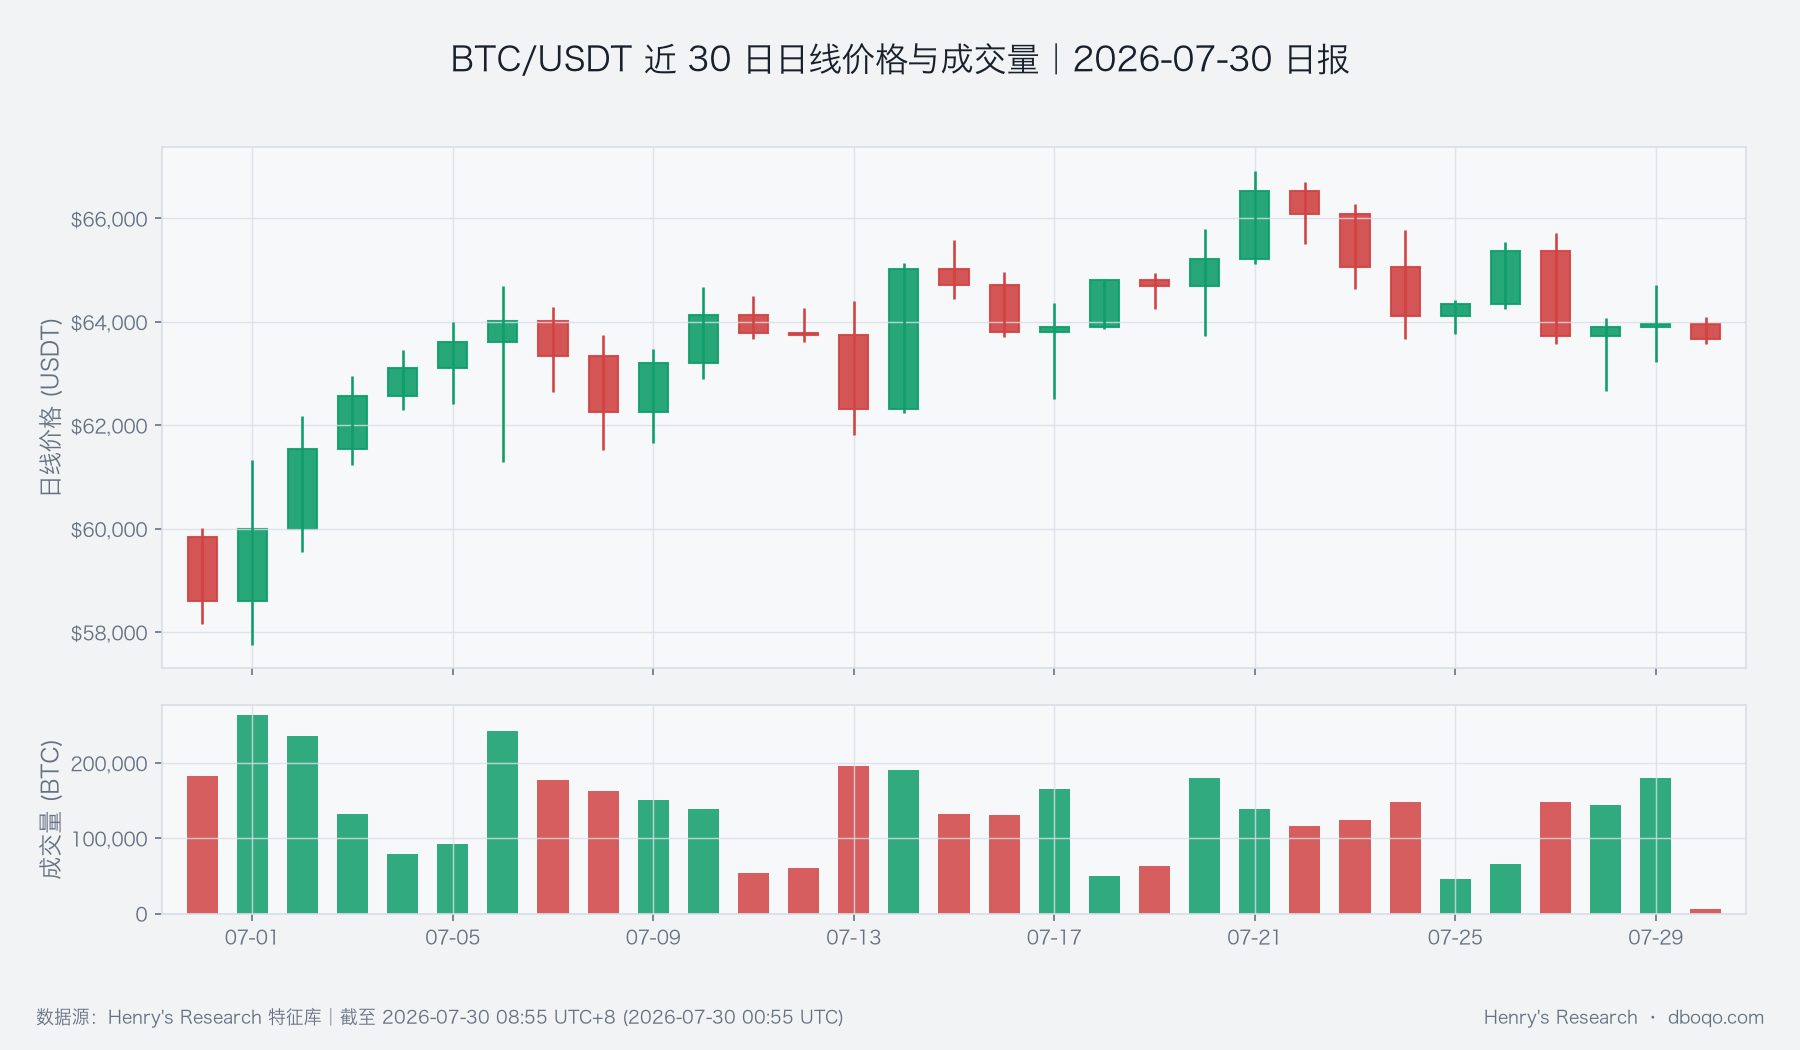
BTC/USDT 30-day daily price and volume
The past 30-day trend shows that, after retreating from highs in mid-to-late 7月, the price repeatedly tested the 63,000 area. Volume over the latest 24 hours was not low, yet the rebound high was not held. In other words, the market does not lack participants; it lacks buyers willing to continue taking over at higher prices. Readers should focus on whether support can continue to form near 63,234 and whether trading volume expands in step during rebounds. Only when price and volume improve together will the rebound become more credible.
II. Technical Indicators
The current price is below the 10-day moving average of 64,831.18 USDT and also slightly below the 30-day moving average of 63,716.13 USDT, with short-term pressure stronger than longer-term support. Moving averages can be understood as the market's average holding cost over a period: when price is below them, recent buyers as a whole are more likely to face pressure. The daily relative strength indicator is 48.75, still in neutral territory; the daily momentum histogram is -110.56 USDT, indicating that trend repair has not yet been completed. The short-term relative strength indicator has fallen to 38.58, meaning selling pressure is already fairly evident, although there remains room before an extreme condition.
The 14-day average true range is 1,473.31 USDT, close to the 1,481.90 USDT high-low spread over the past 24 hours, indicating that the day's moves have already covered a typical daily range. If the price cannot rise above the 30-day moving average, weakness may continue; if it reclaims that line and advances toward the 10-day moving average, downward momentum will begin to ease.
III. Derivatives and Fund Flows
The perpetual funding rate is +0.0085%, the long-short ratio is 1.58, futures basis is +0.04%, and open interest increased 1.10%. This set of data indicates that long participation still holds the advantage and that futures exposure continues to increase as price pulls back. The key here is not that “more longs necessarily mean a rise,” but that after more capital is positioned in the same direction, if price fails to rise for an extended period, exits may squeeze one another; if spot buying support is insufficient, the crowded direction is more likely to amplify short-term volatility. Meanwhile, the active trading imbalance slope is -3.61 BTC, with sellers slightly more active, corroborating the price weakness.
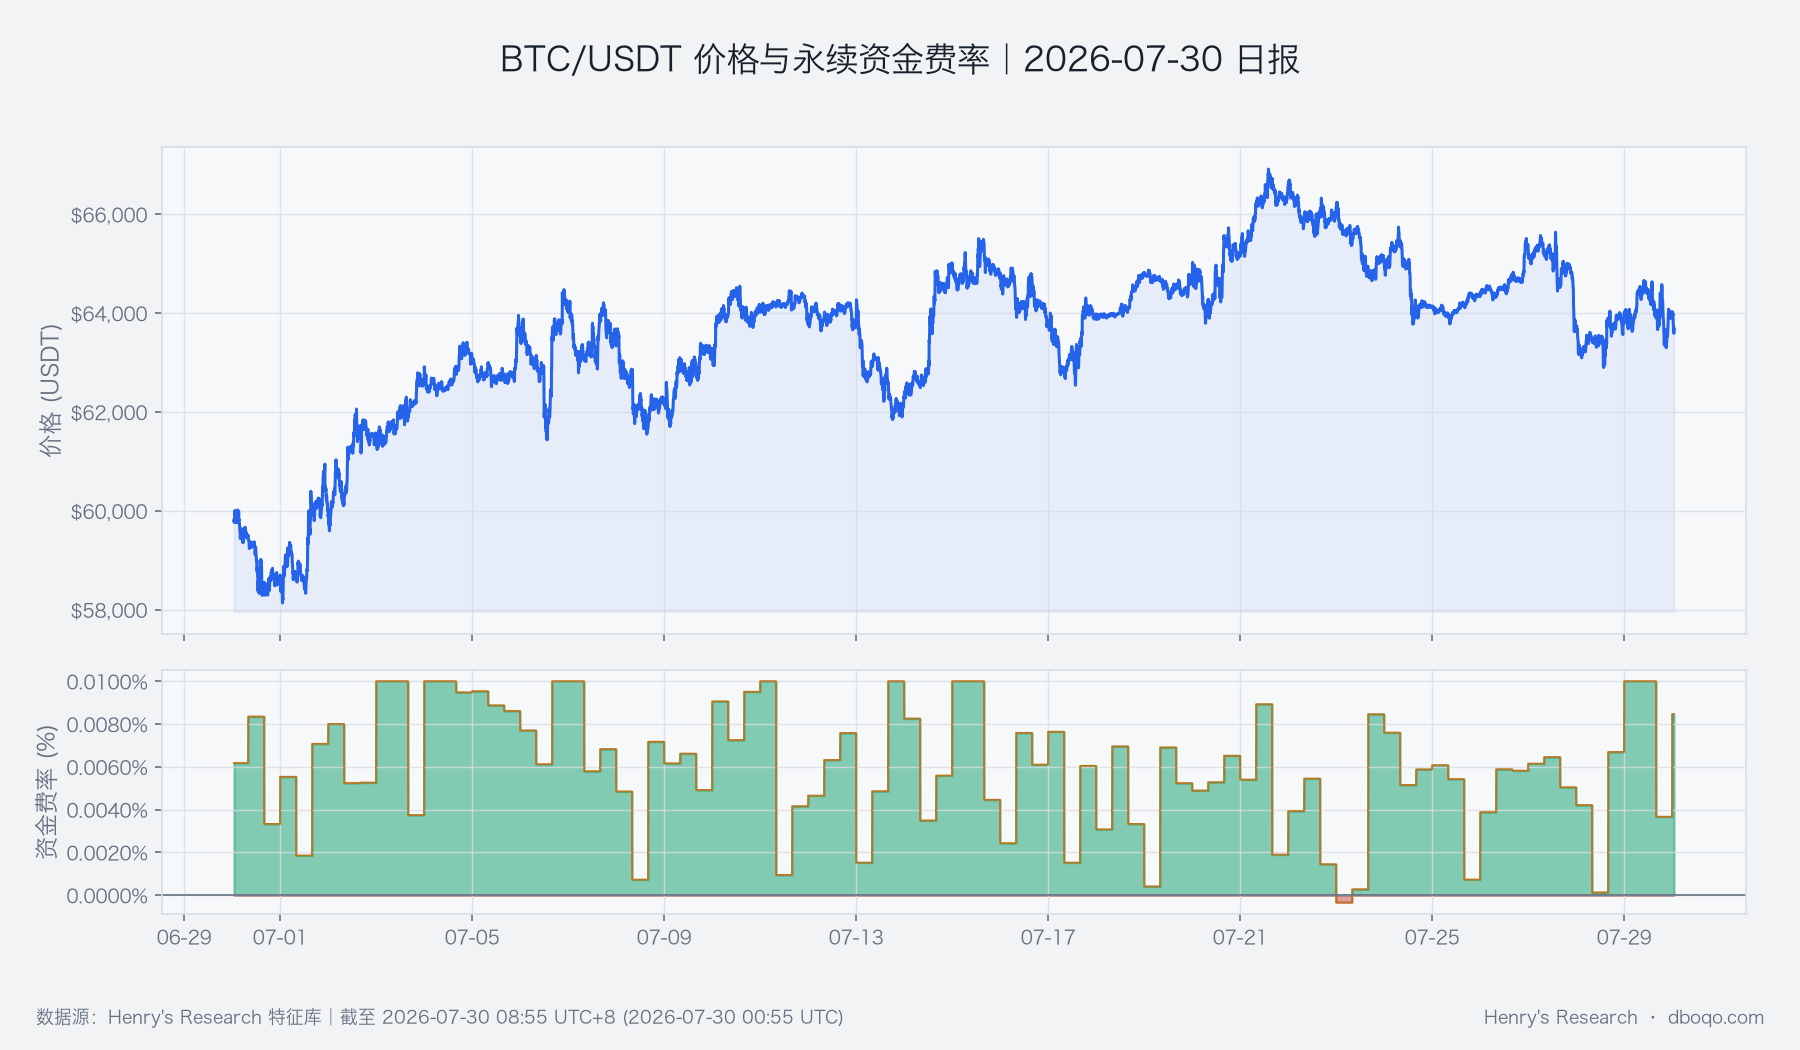
BTC/USDT 30-day price and perpetual funding rate
Daily liquidations are a daily-frequency quantity proxy for the covered BTC perpetual markets, at 350.735 BTC, with a 30-day cumulative total of 11,794.386 BTC. The current reading does not show an unusually concentrated release, so it is more suitable as volatility context than as an independent directional signal. If the price later falls below the range low while open interest continues to rise, attention should be paid to the possibility that forced liquidations could amplify volatility.
IV. Cross-Market Environment
ETF flows over the past 5 days were a net outflow of 5.42亿美元, while stablecoin supply contracted 0.46% and 0.91% over 7 days and 30 days respectively, jointly pointing to caution in available off-exchange and on-chain liquidity. Put simply, incremental capital able to enter the crypto market quickly is declining, making price rebounds more dependent on follow-through from existing capital. This is consistent with the direction of short-term price weakness and is a more important set of the current bearish evidence. The U.S. Dollar Index is 101.37 and the volatility index is 18.16; the external risk environment has not become extremely stressed.
The 30-day correlation coefficient between BTC and the S&P 500 is -0.0597, close to zero, indicating that recent BTC movements cannot be simply inferred from U.S. equity gains or losses. The external environment has not yet created a strong shock, but it is also insufficient to offset ETF outflows and stablecoin contraction; readers should treat whether fund flows stabilize as an important condition for judging rebound quality.
V. Overall Assessment
Viewed together, the dominant signals are that price has fallen below both moving averages, daily momentum is weak, and ETF and stablecoin funds are contracting simultaneously; countervailing factors are that the daily relative strength indicator remains neutral and price is close to the 30-day moving average, without confirmation of an effective breakdown. Rising futures positions while active selling holds the advantage tilt short-term risk downward, but the 63,000 area may still see repeated contention. This is not a judgment that price will fall in a straight line; it indicates that, before funds improve again, there are more obstacles for an advance to overcome.
Directional assessment: Bearish. This is a conditional conclusion based on technical structure, active trading, and cross-market fund-flow evidence. The dominant signals are pressure from both moving averages and fund contraction; the countervailing risk is buying support near the 30-day moving average and neutral daily momentum.
Assessment horizon: The next 1–3 days. Conditions for validity: Price remains below 63,716.13 USDT, rebound volume is insufficient, active selling continues, and ETF and stablecoin funds do not improve. Invalidation conditions: Price regains a stable position above 64,831.18 USDT, active buying strengthens, and observable fund flows shift from weak to stable.
VI. Risk Notice
The current price is close to key moving averages and intraday support, so signals can readily reverse; increasing futures exposure may also amplify two-way volatility. No single indicator can independently confirm a trend, and validation should combine closing position, trading volume, and continuous changes in fund flows.
Disclaimer: All data in this report are sourced from the dboqo feature library, as of 2026-07-30 08:55 UTC+8. Cryptocurrency markets are highly volatile. This report is only an objective analysis of market phenomena and does not constitute any investment advice; investors must assess risks independently and make prudent decisions.