I. Market Overview
Data basis: As of 2026-7-31 08:55 (UTC+8), BTC/USDT was quoted at 64,703.90 USDT, up 1.62% over the past 24 hours, with a range of 63,662.60 to 65,157.00 USDT and volume of 109,320 BTC. The most straightforward change is that price rebounded from the lows, but did not continue expanding meaningfully after approaching 65,000, indicating that buyers recovered the decline but have not yet formed sustained strength sufficient to confirm a breakout.
The importance of this rebound is that price has moved back above the 30-day average cost of 63,920.95, meaning medium-term market support has not been broken; however, it remains slightly below the 10-day moving average of 64,783.70. Moving averages can be understood as the market's average transaction price over a period; trading above them usually indicates that buyers have the advantage during that period. Long-cycle support and short-cycle resistance now coexist, so it is not appropriate to judge that the trend has strengthened based solely on a single day of gains.
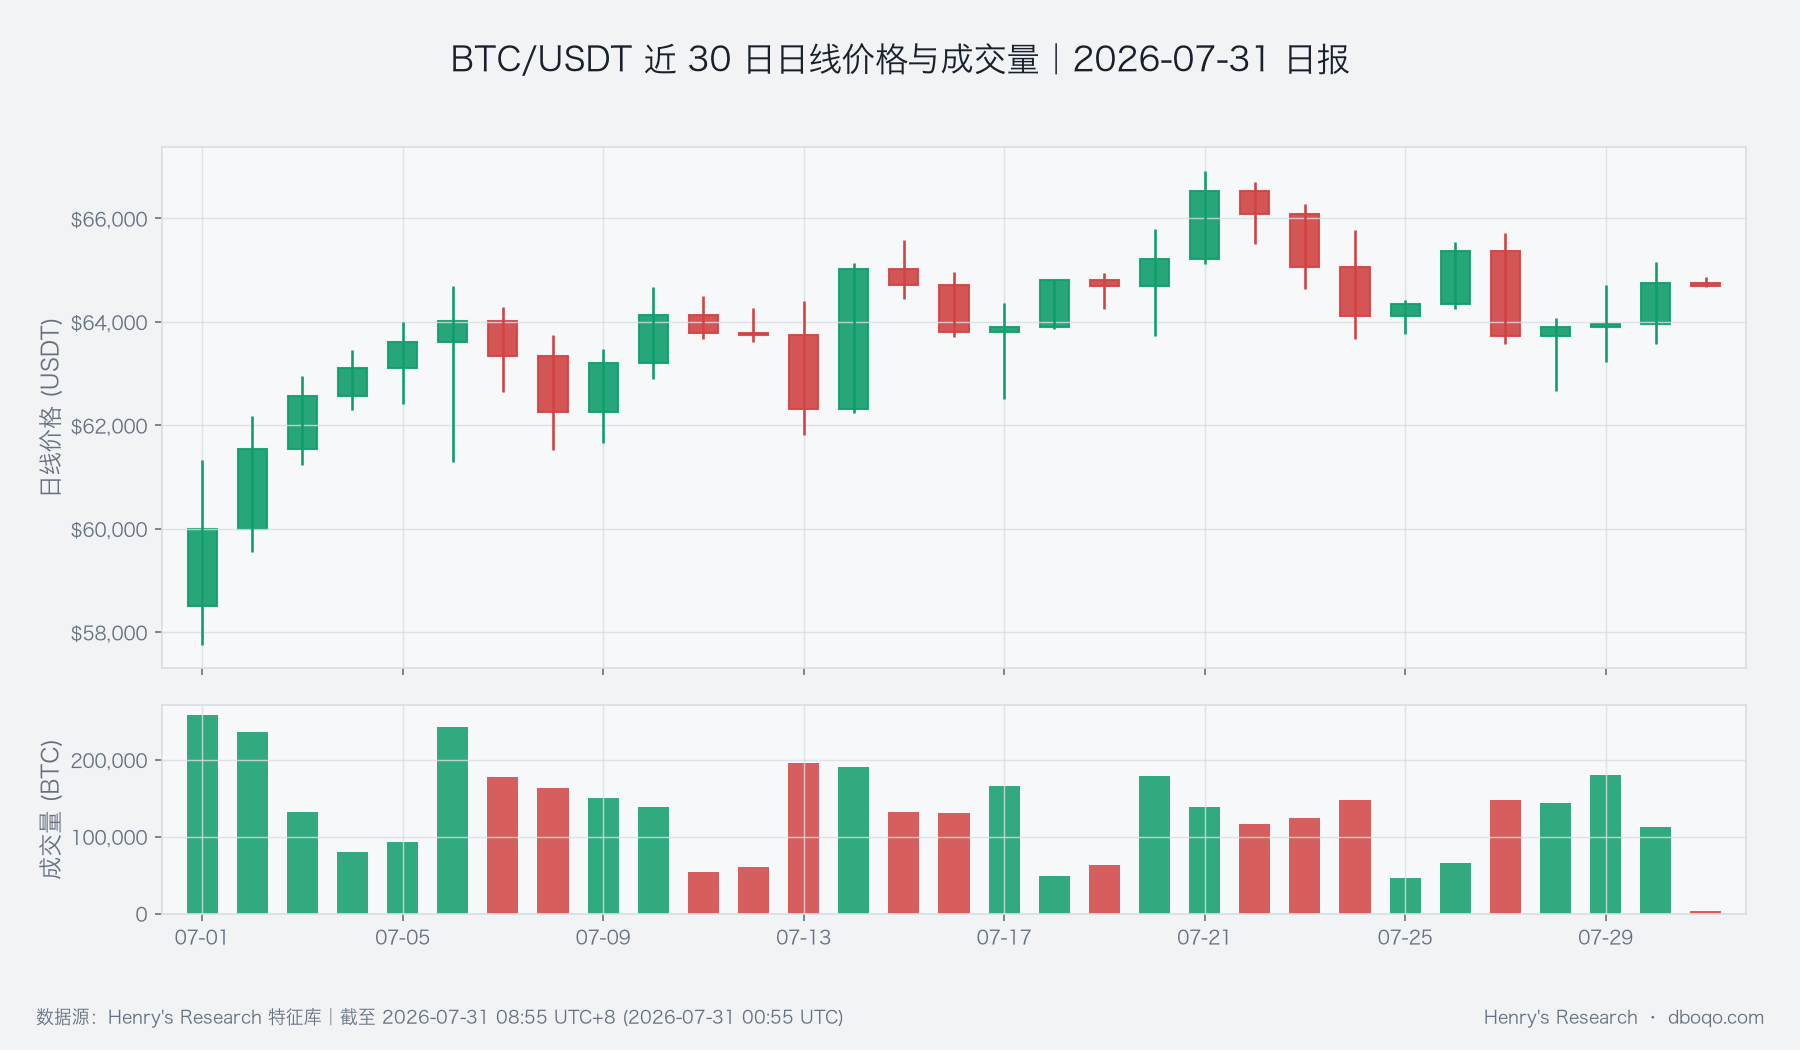
BTC/USDT price over the past 30 days has recovered above the long-cycle moving average, but remains consolidating within the recent high-volume trading zone in the short term.
II. Technical Indicators
The daily relative strength indicator is 52.47, in a relatively balanced zone between bulls and bears. This indicator measures the speed of recent gains and losses; a reading near 50 indicates that neither side has an overwhelming advantage. The intraday reading of 42.55 shows that the latest rebound momentum has cooled somewhat. Together, these indicate that the daily structure has not entered an overheated state, but short-term follow-through buying is also weak, making price more likely to first absorb resistance near 65,157.
The daily trend momentum differential is -76.97, still below the zero line, suggesting that medium-term upward momentum has not fully recovered. Meanwhile, the 14-day average true range is approximately 1,496.08 USDT; it reflects the price range that can typically occur in a recent day, rather than predicting direction. The current 24-hour high-low spread is close to this scale, indicating that the market has already released a considerable portion of its usual daily volatility. If additional volume is lacking afterward, continued one-sided expansion will become more difficult.
III. Derivatives and Fund Flows
The perpetual funding rate is +0.0100%, meaning the mildly bullish side pays a small fee to the mildly bearish side, indicating moderately bullish derivatives sentiment; the long-short ratio of 1.26 also shows that long participants have the advantage. Open interest increased 2.14% over the past 24 hours. It represents the scale of contracts that remain unsettled; when price rises while this scale increases, it usually indicates that new funds are participating. However, the spot-perpetual price spread is -0.04%, which does not show a strong premium, and derivatives activity has not yet formed a consistent chase-higher signal.
In contrast to warmer derivatives sentiment, the aggressive-trading slope is -90.71 BTC, indicating that recent aggressive sell transactions still hold a slight advantage. Aggressive trading can be understood as the side willing to immediately accept the counterparty's quote, and it can reflect who is more eager to transact. The daily quantity proxy for the covered BTC perpetual market is 150.628 BTC, with a cumulative 30-day total of 11,369.886 BTC; the current value is used to observe the degree of pressure release and cannot be equated with immediate risk across the entire market. Expanding derivatives while aggressive selling has not receded is today's most important internal contradiction to watch.
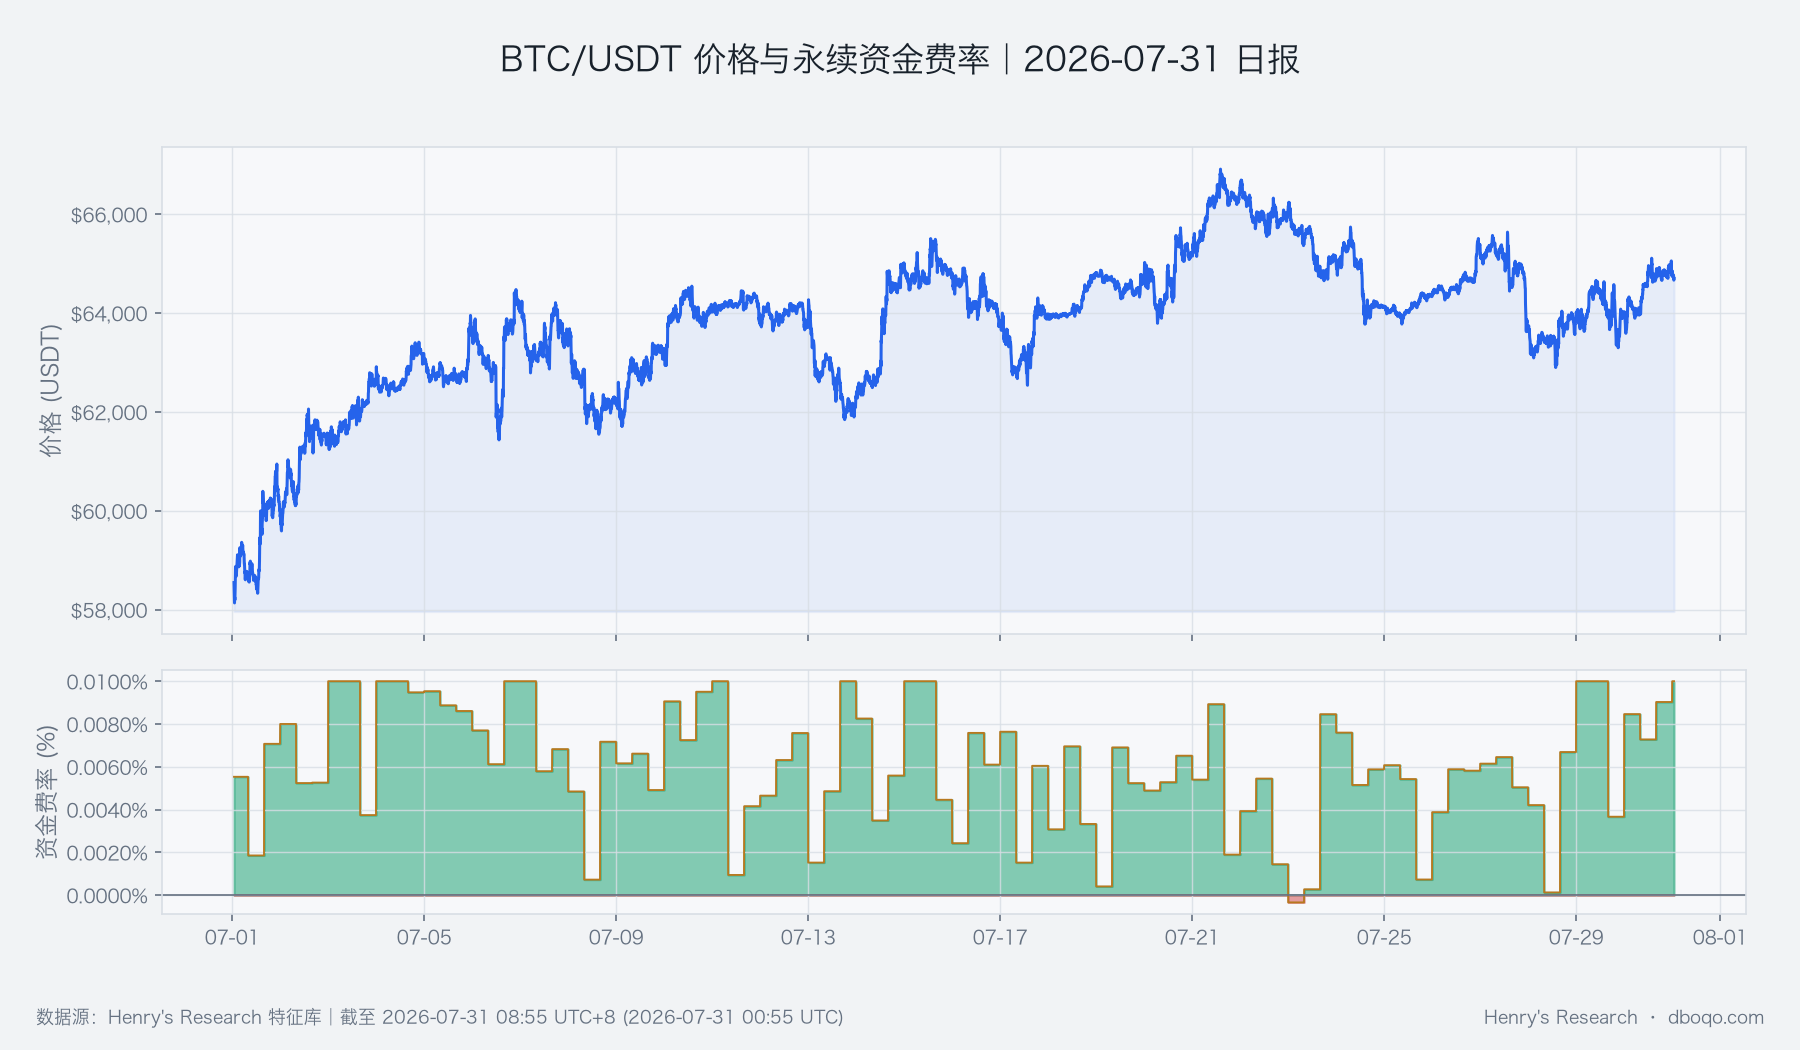
BTC/USDT price and perpetual funding rates over the past 30 days show warmer derivatives sentiment, but no extreme crowding has emerged.
IV. Cross-Market Environment
Off-exchange funding signals remain cautious. ETF net outflows over the past 5 days totaled $2.39 billion; ETF fund flows reflect changes in traditional capital entering or leaving Bitcoin through regulated products, but can only serve as a conditional signal and cannot independently explain price. Stablecoin supply declined 0.95% over the past 7 days and 0.99% over the past 30 days; stablecoins are often regarded as available liquidity in the crypto market, and their contraction means potential buying power has not improved in tandem. Both funding indicators are weak in the same direction, constraining the sustainability of this rebound.
The U.S. dollar index is 100.94 and the volatility index is 19.09, with the macro environment offering no extreme risk signal. The 30-day correlation coefficient between BTC and the S&P 500 is only 0.0056, close to zero, indicating that the two have had almost no stable synchronized relationship recently. Therefore, even if traditional risk assets strengthen, it cannot be directly inferred that BTC will follow; the current assessment should rely more on whether its own price, trading activity, and fund flows form a combined force.
V. Overall Assessment
Overall, the price rebound and hold above the 30-day moving average are the main supports, while the mildly positive funding rate and increase in open interest also indicate that the market does not lack participants. Risks in the opposite direction come from aggressive selling still holding the advantage and simultaneous contraction in ETF and stablecoin funds. The most reasonable interpretation is not that the trend has already reversed, but that medium-term support is holding price while a short-term breakout still lacks funding confirmation; whether sustained volume can absorb the area near 65,157 will determine the next direction.
Directional view: Range-bound. This is a conditional conclusion based on price-structure and fund-flow evidence: long-cycle support limits downside, while aggressive selling and shrinking off-exchange funds limit upside; it does not represent a certain outcome.
Assessment horizon: Next 1–3 days. Conditions for validity: Price remains above the 30-day moving average near 63,920, volume does not contract materially, and aggressive selling pressure gradually eases. Invalidation conditions: If price holds above 65,157 with increased volume and fund flows improve, the range-bound view will shift bullish; if price falls below 63,663 while open interest continues expanding, downside risk will increase significantly.
VI. Risk Reminder
Current typical daily volatility is approximately 1,496 USDT, and substantial fluctuations may still occur over a short period. ETFs, stablecoins, macro indices, and correlations all have publication timing and statistical boundaries; they are suitable only for validating conditions and cannot be regarded as immediate causal relationships. Readers should focus on whether a price breakout receives confirmation from volume and aggressive buying, and guard against rapid deleveraging volatility after derivatives scale expands.
Disclaimer: All data in this report are sourced from the dboqo feature repository, as of 2026-07-31 08:55 UTC+8. Cryptocurrency markets are highly volatile. This report is solely an objective analysis of market phenomena and does not constitute any investment advice; investors must assess risks independently and make prudent decisions.