I. Market Overview
Data basis:As of 2026-8-2 08:55 (UTC+8), BTC/USDT was quoted at 62,807.50 USDT, down 0.16% over the past 24 hours, trading in a range of 62,228.80 to 63,126.60 USDT, with volume of 55,478 BTC. Simply put, after a rapid pullback on the previous day, the price has temporarily stabilized, but the rebound has been limited. The market is still absorbing overhead selling pressure, and the current pattern looks more like weak consolidation.
What matters is that price stability does not mean the pressure has disappeared. The current close remains below the 10-day moving average of 64,088.48 USDT and the 30-day moving average of 64,058.02 USDT. The two moving averages are clustered near 64,000 USDT, forming a clear overhead test zone. Meanwhile, the aggressive-trading slope has rebounded to 63.68 BTC, indicating a relative improvement in recent aggressive buying and providing some support at lower levels. The simultaneous presence of weak prices and recovering buying is today’s most noteworthy contradiction.
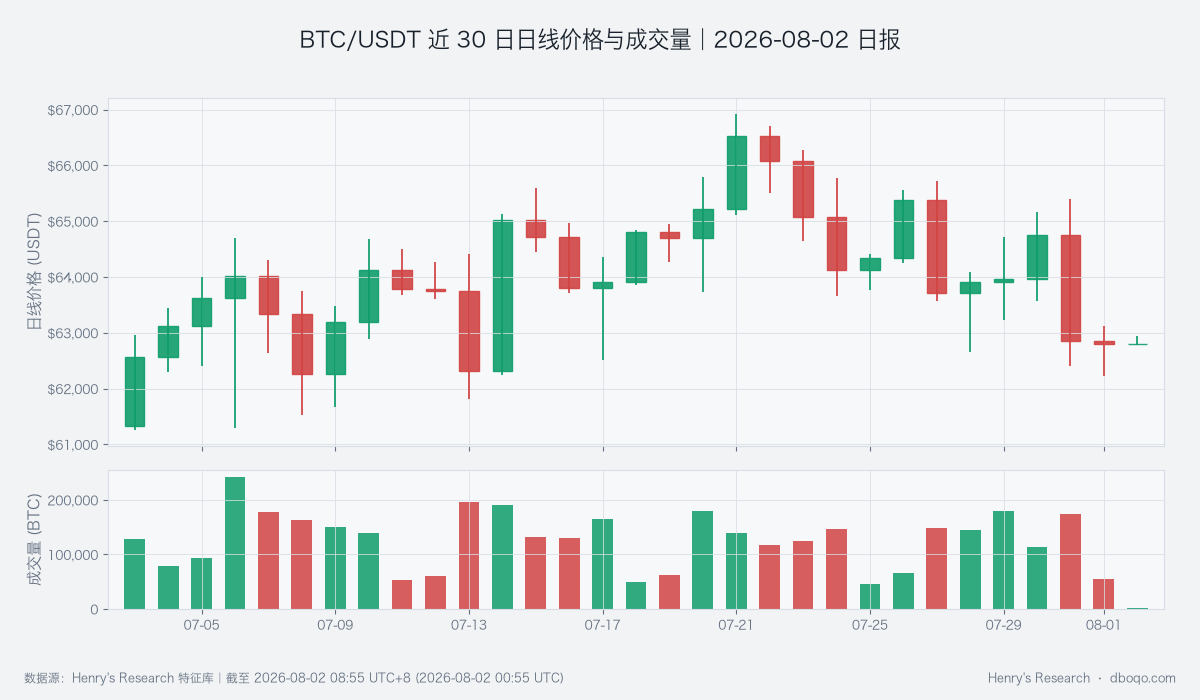
BTC/USDT daily price and volume over the past 30 days, showing the recent pullback and volume changes.
II. Technical Indicators
Moving averages can be understood as an approximate reference for the market’s average cost over a period. The current price is about 1,281 USDT below the 10-day moving average and about 1,251 USDT below the 30-day moving average, so any rebound must first contend with trapped positions. The two moving averages differ by only about 30 USDT, making the area around 64,000 USDT especially important: if price cannot reclaim it, sellers still dominate the structure; if price can regain it on expanding volume, the weak-market assessment would ease materially.
The daily relative strength indicator is 43.95. It is used to observe recent upward and downward momentum; the area near 50 represents relatively balanced strength. It currently shows a slight seller advantage, but not an extreme oversold condition. The daily momentum histogram is -233.46 USDT, indicating that medium-term downside momentum has not fully faded; the daily average true range is about 1,571.02 USDT, suggesting volatility may still expand. The intraday relative strength indicator of 48.88 is relatively neutral, consistent with improved support at lower levels, but insufficient on its own to reverse daily-chart pressure.
III. Derivatives and Fund Flows
The perpetual funding rate is +0.0045%, the periodic fee paid between longs and shorts; a positive value means longs are willing to pay a small cost, implying bullish sentiment that is not yet extreme. The long-short account ratio is 2.21, with significantly more long accounts. If price cannot return above the moving averages for an extended period, crowded longs may amplify downside volatility. Open contract interest declined by 0.94% over the past 24 hours, indicating that some positions are exiting and near-term contract pressure has eased.
The turn to a positive aggressive-buying slope is a relatively favorable detail beyond derivatives, but buying and selling volume over the latest hour are close, and support has not yet formed an overwhelming advantage. The daily quantity proxy for covered BTC perpetual markets is 216.182 BTC, and the cumulative 30-day figure is 10,743.683 BTC. It can only be used to observe volatility pressure and cannot be treated as the real-time liquidation scale of the whole market. Overall, contract sentiment remains bullish while positions are shrinking, suggesting participants are retaining directional expectations while reducing risk exposure.
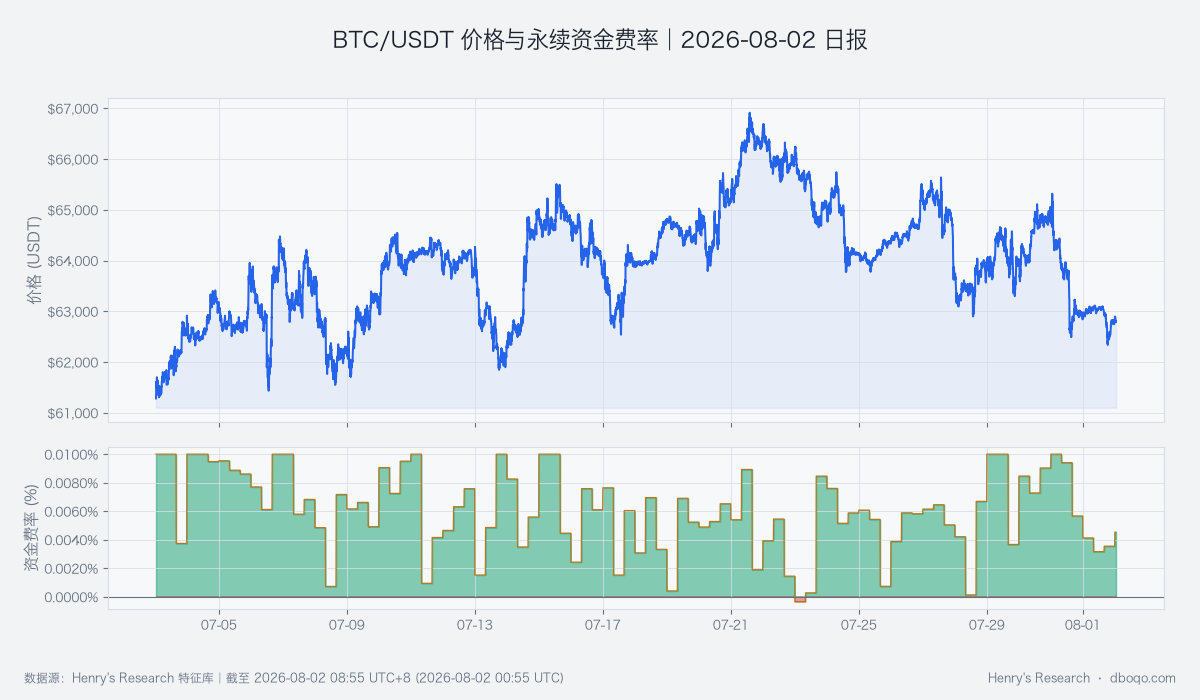
BTC/USDT price and perpetual funding rates over the past 30 days, observing whether price and contract sentiment are moving in sync.
IV. Cross-Market Environment
ETFs recorded net outflows of 3.15 billion USD over the past 5 days, indicating weaker marginal market support from this channel recently; it can only serve as a conditional signal for the funding environment and cannot independently explain price changes. Stablecoin supply declined by 0.99% over 7 days and by 0.88% over 30 days. Stablecoins can be broadly understood as readily deployable cash within the crypto market, and their continued contraction implies more cautious incremental buying power. The simultaneous weakening of ETFs and stablecoins is the most important external funding evidence behind today’s bearish assessment.
The dollar index is 100.19 and the volatility index is 15.99, indicating that fear pricing in traditional markets is not high. The 30-day correlation coefficient between BTC and the S&P 500 is -0.0954, close to zero, indicating weak recent linkage between the two and that BTC cannot simply be inferred from the direction of U.S. equities. In other words, external risk sentiment is not currently the main drag. What truly needs to be watched is whether crypto-market funds can stop flowing out and whether price can again gain acceptance around 64,000 USDT.
V. Integrated Assessment
Taken together, the dominant pressure comes from price trading below both moving averages, negative daily momentum, and the simultaneous contraction of ETF and stablecoin funds. Offsetting buffers come from improved aggressive buying, intraday momentum returning to neutral, and a decline in contract scale. The latter indicates that lower levels are not without support, and shrinking risk positions have made short-term pressure milder than before. However, a price breakout and support from new funds are still lacking, so the rebound looks more like a test of the resistance zone.
Directional assessment:Bearish; this is a conditional conclusion based on the current price structure and funding environment. The recovery in aggressive buying and easing in contract risk are the main countervailing risks, and do not represent a certain price path.
Assessment horizon:The next 1–3 days.Conditions for validity:Price remains constrained by the dual moving averages near 64,000 USDT, rebound volume does not expand materially, and ETF and stablecoin funds remain weak.Invalidation conditions:Price holds above 64,100 USDT on expanding volume, aggressive buying continues to strengthen, and open interest rises moderately rather than expanding in a crowded manner.
VI. Risk Notice
The current 24-hour range is narrow, but the daily average true range still exceeds 1,500 USDT. The appearance of low volatility may quickly be broken by new fund flows or contract adjustments. If price falls below the intraday low of 62,228.80 USDT, watch whether selling pressure is accompanied by expanding volume; if it breaks above 63,126.60 USDT, the area around 64,000 USDT must still be tested, and a strengthening trend cannot be confirmed from a single short-term rally alone. Changes in weekend liquidity may also make prices more sensitive to individual trades.
This report emphasizes conditions and invalidation points to help readers distinguish between “temporary stabilization” and “trend reversal.” ETFs, stablecoins, correlations, and liquidation proxies each have their own statistical frequencies and coverage, and can only corroborate one another; they cannot be regarded as single causal evidence. Any directional assessment should be adjusted as price, volume, and funding data are updated.
Disclaimer:All data in this report are sourced from dboqo feature store, as of 2026-08-02 08:55 UTC+8. Cryptocurrency markets are highly volatile. This report is only an objective analysis of market phenomena anddoes not constitute any investment advice, and investors must assess risks independently and make prudent decisions.