I. Weekly Overview
Data methodology:This report covers the complete UTC calendar week from 2026-7-27 00:00 to 8-3 00:00, comprising 2,016 consecutive 5-minute observations; data are current through 2026-8-2 23:55 UTC. BTC/USDT fell from 65,375.20 to 63,550.00, down 2.79% for the week, with an intrawEEK high of 65,722.50, a low of 62,228.80, and cumulative trading volume of 898,681 BTC. The market was not defined by a one-way decline, but by an early-week plunge, a midweek repair, and another volume-led decline on Friday, before weekend buying pulled price back above 63,000.
On 7-27, price opened at 65,375.20 and closed at 63,720.80, with full-day volume of 147,832 BTC, losing high-level support at the start of the week. After falling to 62,660.10 on 7-28, it returned to 63,903.60; on 7-29, volume rose to 179,976 BTC, the week’s most active day, but the close edged up only to 63,958.90, indicating that higher turnover did not immediately translate into a trend breakout.
On 7-30, price briefly reached 65,157.00 and closed at 64,750.00. The continuity of the repair was then interrupted by a sharp pullback on 7-31, with a low of 62,410.50, a close of 62,859.90, and volume of 174,965 BTC. On 8-1, volume contracted to 54,738 BTC and set the weekly low of 62,228.80; on 8-2, price recovered to 63,550.00, up 1.21% over the past 24 hours. The weekend rebound eased short-term pressure but has not yet reclaimed the week’s starting point.
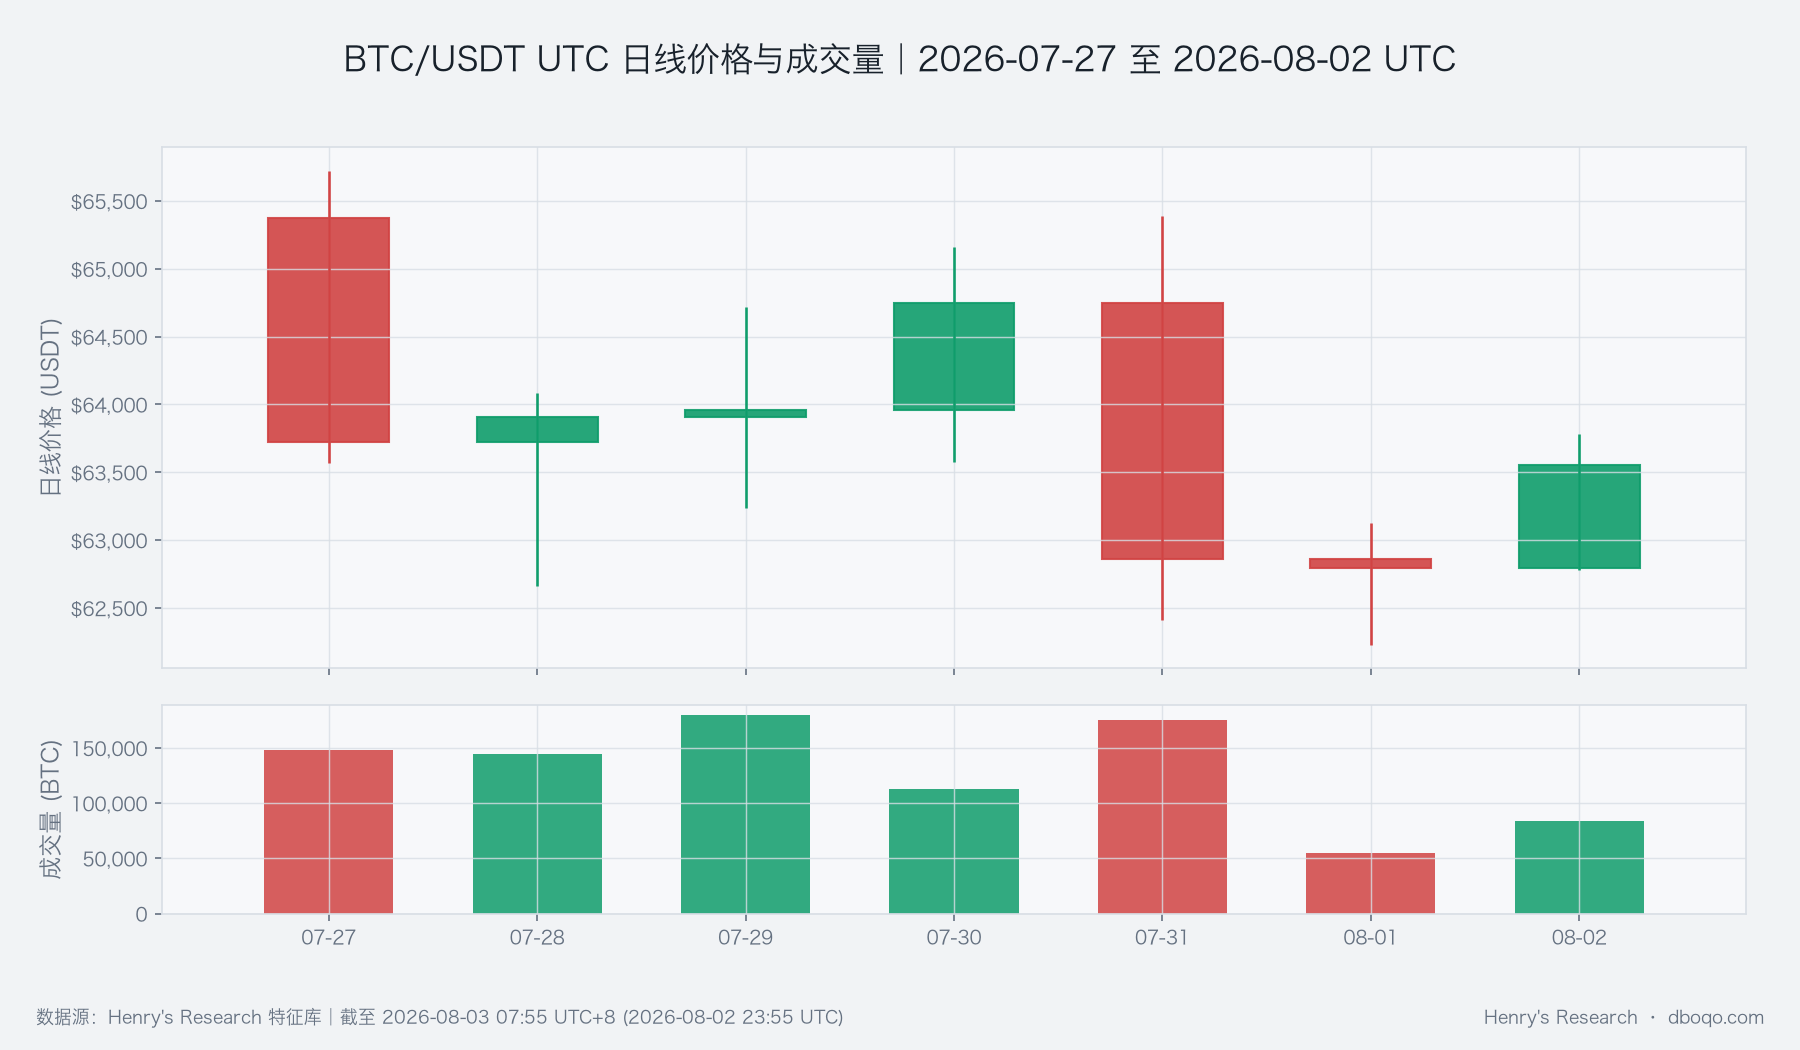
The first chart shows that the largest trading volume was concentrated in Wednesday’s turnover and Friday’s decline, while Sunday’s rebound volume was lower than during those two pressure periods. Although price recovered 1,321.20 USDT from the weekly low, the combination of volume expansion on the decline and comparatively moderate volume during the repair suggests that 63,550.00 is more likely an initial repair level than a confirmed new upward structure.
II. In-Depth Technical Analysis
The daily 10-day moving average is 64,088.48, and the 30-day moving average is 64,058.02. They are close together and both above the weekly close. The moving averages have not yet clearly widened, but price is below them, making 64,058 to 64,088 the most direct structural validation zone for next week. The daily RSI is 43.95, in neutral-to-weak territory; the short-term RSI has returned to 55.36, indicating that the weekend rebound improved immediate momentum without fully reversing daily pressure.
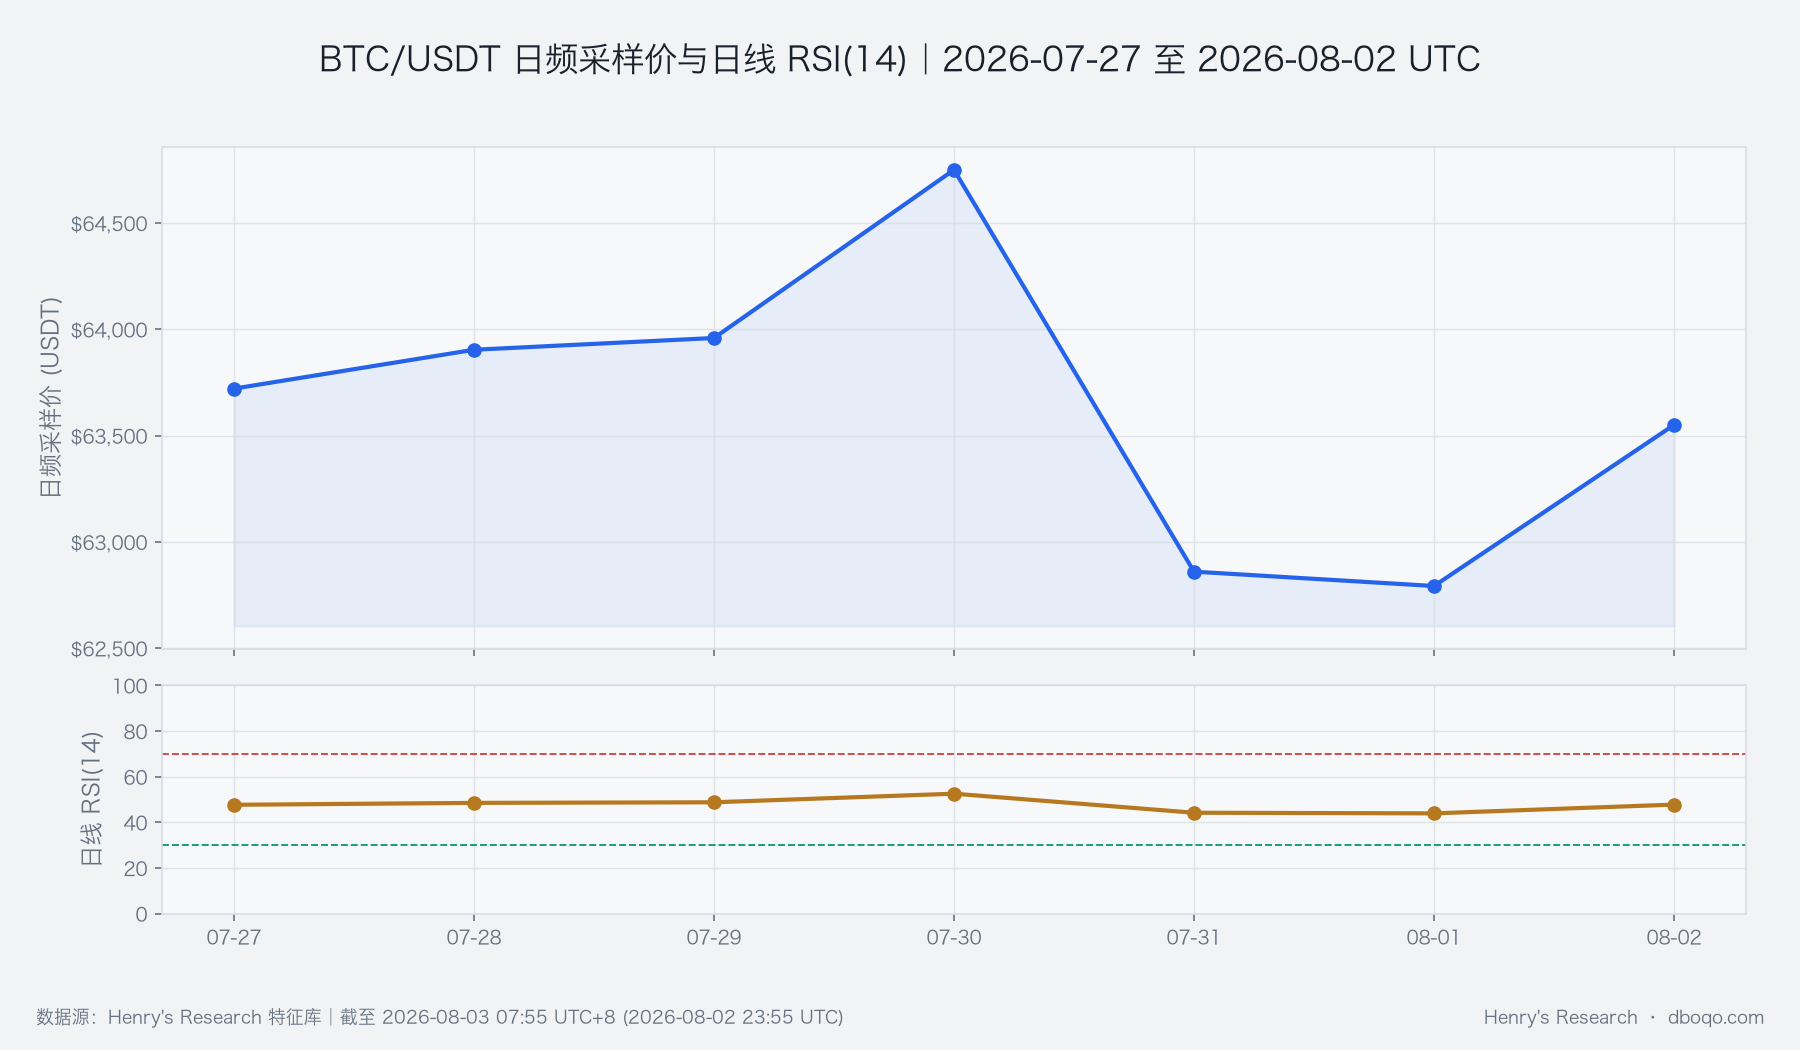
The second chart places price repair and daily momentum on the same timeline. The lows formed from Friday to Saturday were not accompanied by the daily RSI entering an extreme range, indicating that the market still has room to continue absorbing pressure. Conversely, Sunday’s price recovery indicates support near 62,228.80. The daily MACD histogram is -233.46, still indicating weak medium-term momentum; daily ATR is 1,571.02 USDT, which also means intraday volatility may remain sizable next week even if direction is undecided.
III. Derivatives Market
The period-end funding rate was +0.0077%, and the long-short ratio was 1.94, indicating some remaining long bias; however, the basis was -0.03%, and open interest fell 0.94% over nearly 24 hours. The central tension in these data is that participants are directionally long, but there is no corresponding expansion in contract support. The weekend rebound is therefore closer to a price repair and replenishment after risk was released; whether it can continue depends on whether open interest and basis can improve together.
Liquidations on the latest complete day were 216.182 BTC, while the 30-day measure was 10,743.683 BTC. Both are processed as daily observations. The 30-day value is a rolling result based on the final observation of each day and must not be summed again across repeated 5-minute values. Liquidation data can indicate the intensity of recent volatility’s impact on contract positions, but cannot alone prove the subsequent direction, much less infer the behavior of specific participants.
IV. Capital Flows and Cross-Market Factors
ETFs recorded net outflows of 3.15 hundred million USD over the past 5 days; stablecoin supply fell 0.99% over the past 7 days and 0.88% over the past 30 days. Price recovered over the weekend while both off-exchange capital indicators remained contractionary. This is the week’s most important capital-flow tension: short-term active buying can repair price, but broader incremental liquidity has not yet provided support. These indicators use daily or provider rolling methodologies and have update lags; they should not be matched point by point with individual 5-minute moves.
The latest U.S. Dollar Index is 100.19, and the volatility index is 15.99; the 30-day correlation coefficient between BTC and U.S. equities is -0.0591, close to zero. All three are the latest available lagged daily observations and can only describe the environment, not attribute this week’s price changes. The near-zero correlation also suggests that next week’s assessment should prioritize BTC’s own price, volume, and capital structure rather than assume it will necessarily follow a single external market.
V. Review of Key Events
The first key shift this week was the pullback from elevated levels on 7-27: after price lost 65,000, it rebounded from 62,660.10 on 7-28, but did not regain a firm foothold in the early-week range. The second was the failed move to 65,157.00 on 7-30, followed immediately by a volume-led decline to 62,410.50 on 7-31, showing that repairs above 64,000 remain vulnerable to selling pressure. The third was the return to 63,550.00 after the weekend low was confirmed, indicating that lower levels did not face one-way selling pressure alone.
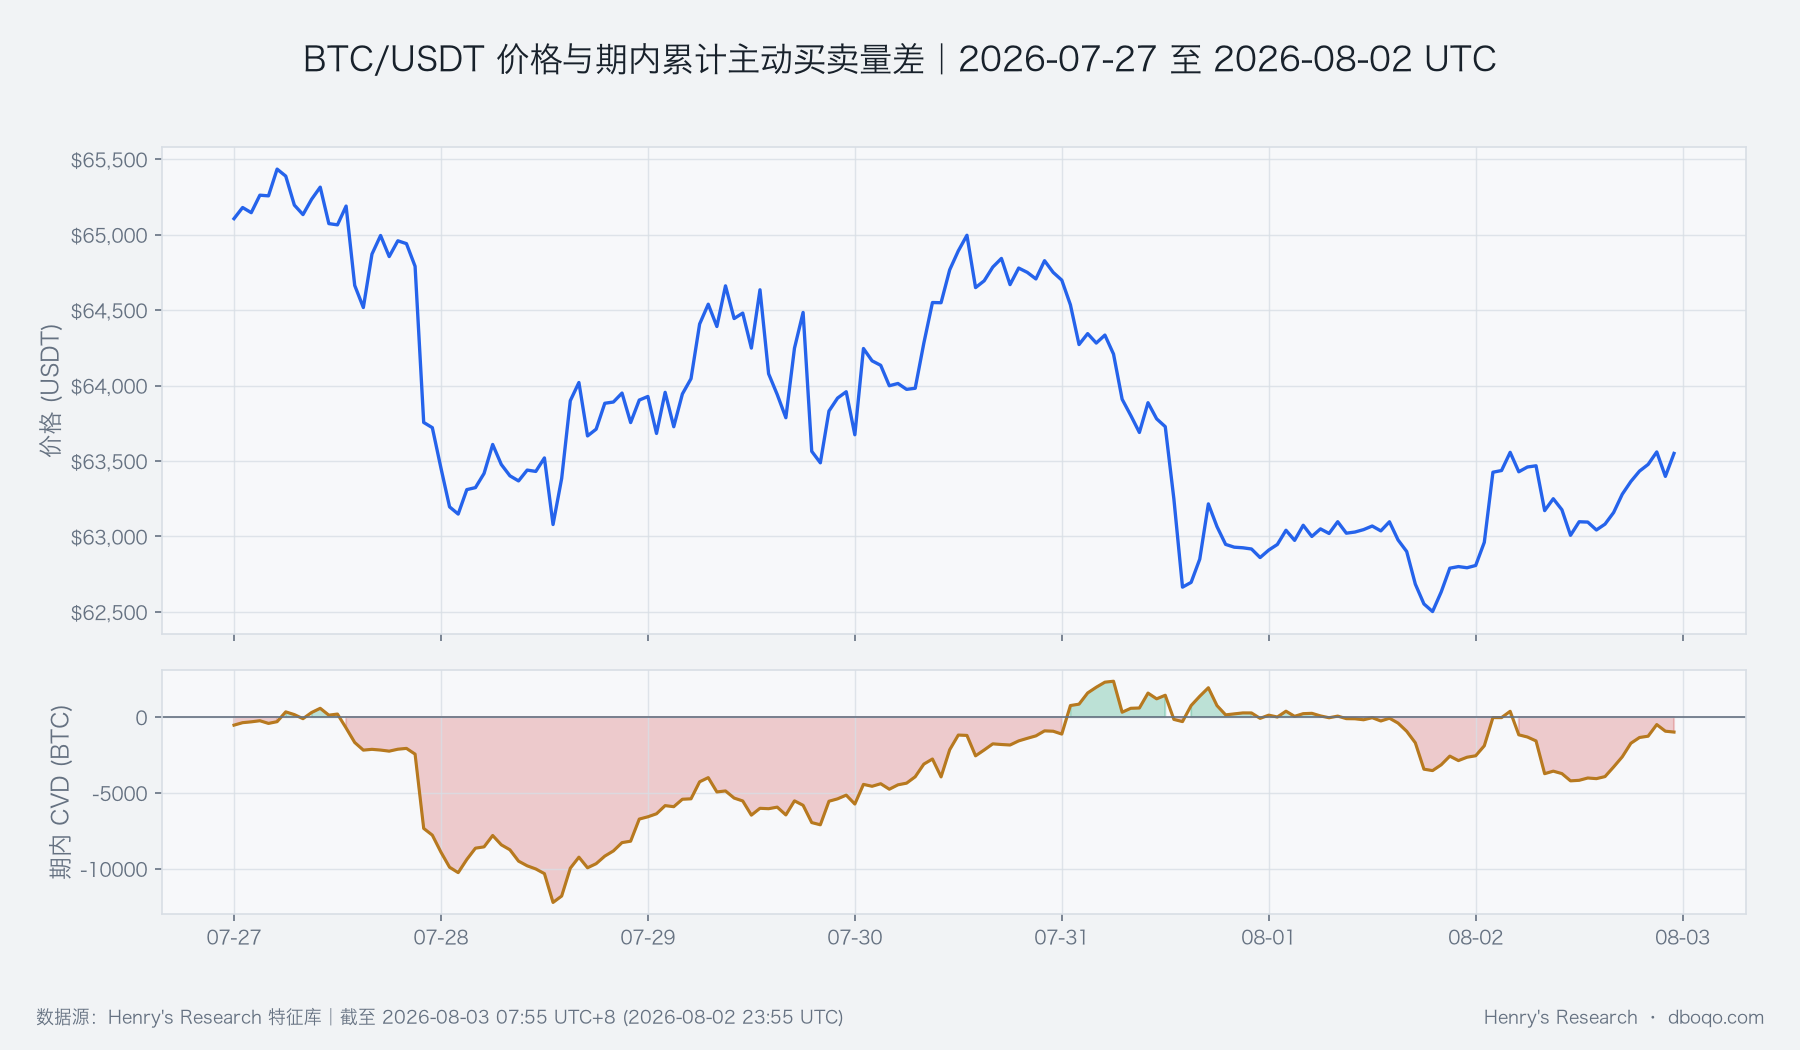
The third chart shows that cumulative active buy-sell imbalance and price did not move in the same direction throughout the week. The period-end slope of the cumulative active buy-sell imbalance returned to 10.38 BTC, echoing Sunday’s price repair. However, the weekly close remained 2.79% below the open, indicating that marginal buying has only temporarily completed a stabilization repair and is still insufficient to offset early-week and Friday selling pressure. If price rises later while active buying weakens again, the quality of the rebound will need to be reassessed.
VI. Integrated Assessment and Strategy Signals
The current structure can be summarized as “short-term repair, medium-term pressure, and weak capital flows.” Supportive factors include buying support near 62,228.80, short-term momentum returning above neutral, and marginal improvement in active buying; constraints include the weekly decline, weak daily momentum, price still below both daily moving averages, and contractionary ETF and stablecoin flows. The three categories of evidence have not yet formed a directional confirmation, so the directional assessment should remain conditional rather than extrapolating Sunday’s rise into a certain trend.
VII. Outlook for Next Week
Conditions for a bullish case:Price first effectively reclaims the 64,058 to 64,088 zone, then retests 65,157 to 65,722 without a material volume contraction, accompanied by simultaneous improvement in active buying and open interest. Only then could the weekend repair develop into a structural rebound.Conditions invalidating the bullish case:Price falls back below 63,000, and the 62,228 to 62,410 support zone is persistently broken on expanding volume, indicating insufficient buying support at this week’s lows.
Conditions for a bearish case:If the rebound is blocked near the two daily moving averages while capital flows continue to contract and contract support does not recover, price may retest the weekly-low area.Conditions invalidating the bearish case:Price holds steadily above 64,088 and further breaks above 65,157, with price-volume action and active buying strengthening in tandem. The key sequence is first to see whether price can hold near 64,000, then whether 65,157 to 65,722 can shift from resistance to support.
VIII. Risk Disclosure
This week’s range reached 3,493.70 USDT, and daily ATR remains 1,571.02 USDT, so the likelihood of crossing key ranges over a short period is not low. ETFs, stablecoins, the U.S. Dollar Index, the volatility index, and correlation all have daily or rolling lags, while liquidation data also cannot explain all price changes. If these indicators’ update times are misaligned, use the latest complete observation and avoid misreading coincident occurrence as certain causality.
Disclaimer:All data in this report are sourced from dboqo feature store, as of 2026-08-03 07:55 UTC+8. Cryptocurrency markets are highly volatile. This report is solely an objective analysis of market phenomena anddoes not constitute any investment advice; investors must independently assess risks and make prudent decisions.