Market Overview
Data scope: As of 2026-08-03 08:55 (UTC+8), BTC/USDT was at 63,298.90 USDT, up 0.78% over the past 24 hours, within a range of 62,807.50 to 63,779.00 USDT, on volume of about 85,420 BTC. In plain terms, price has recovered from the lows but has not established a smooth advance: it pulled back after approaching the top of the range, showing that demand at higher prices remains unstable. The daily gain provides a cushion, but it is not yet enough to reverse the weaker longer-term structure.
The key tension is that the price rebound is occurring alongside shrinking liquidity. On one side, price rose over 24 hours and did not extend the rapid decline seen earlier; on the other, ETFs recorded a net outflow of 5.31 hundred million US dollars over the past 5 days, while stablecoin supply fell 0.99% over 7 days and 0.81% over 30 days. These measures reflect changes in off-market inflows and the liquidity available within crypto markets. Their simultaneous weakening means that further gains will require more genuine buying demand.
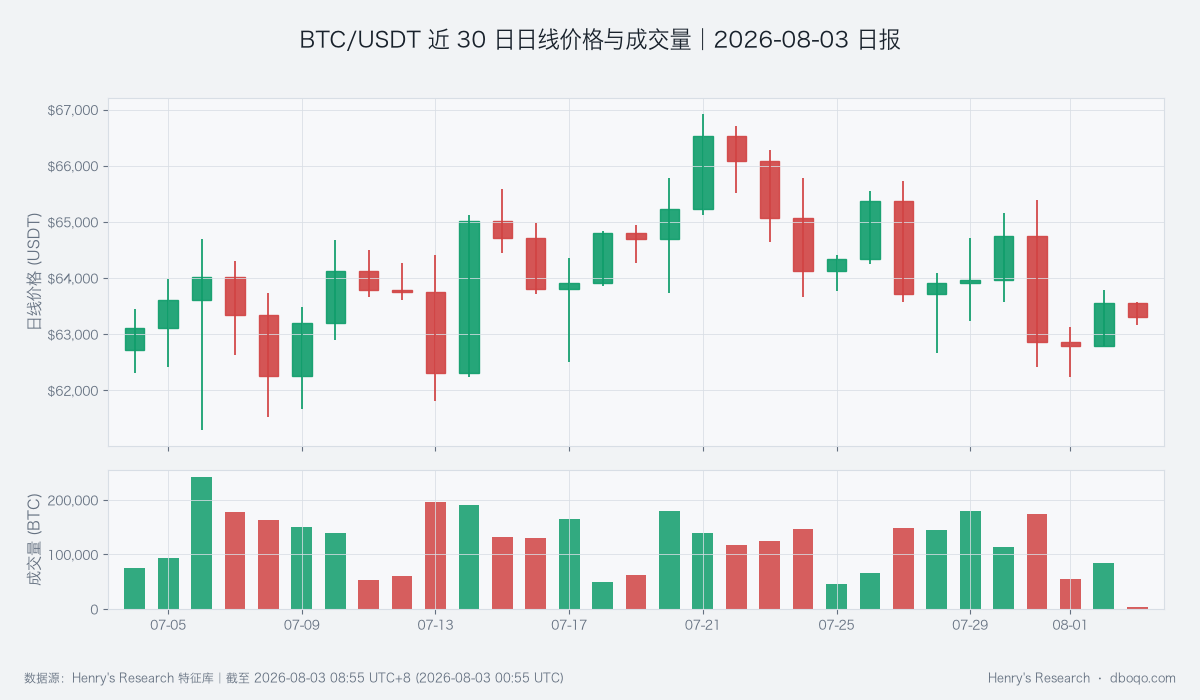
BTC/USDT 30-day daily price and volume
Technical Indicators
Price remains below the 10-day moving average of 63,936.52 USDT and the 30-day moving average of 64,090.84 USDT. A moving average can be understood as the market's average cost over a period of time. With price below both lines, the recent rebound has not yet recovered the cost zone watched by many short- and medium-term participants. The two averages are close together, making 63,900 to 64,100 USDT a concentrated validation zone; holding above it matters more than briefly touching it.
The daily RSI is 47.74, within a broadly balanced area for buyers and sellers. RSI measures the momentum of advances and declines over time, and a reading near 50 indicates that neither side has a decisive advantage. The daily MACD histogram is -210.87 USDT, showing that medium-term momentum remains weak, while intraday RSI has fallen to 40.43, indicating that short-term strength is cooling after the rebound. These indicators align with resistance from the two moving averages, but conditions are not yet extremely oversold, so there is no strong technical reversal signal.
The 14-day average true range is about 1,592.98 USDT, representing the typical daily price movement in recent trading. The current 24-hour high-low spread is about 971.50 USDT, below that reference, indicating that volatility has not fully expanded despite the rebound. If price breaks above the moving averages without a simultaneous increase in volume and range, the move may still be another swing inside the prevailing range rather than a genuine structural improvement.
Derivatives and Fund Flows
The perpetual funding rate is +0.0100%, the long-short ratio is 1.92, and open interest has increased 0.57% from the previous reading. Funding is a periodic payment exchanged between long and short participants; a positive rate usually indicates stronger demand for long exposure. With the long-short ratio near 2, market participants are clearly leaning bullish. When price remains below its moving averages, simultaneous heating in derivatives increases disagreement: if spot demand fails to follow, concentrated longs could amplify a pullback.
The futures-spot basis is -0.03%, close to zero but slightly negative, indicating that derivatives do not carry a strong premium. The cumulative active-trade slope is -45.10 BTC, showing that active selling has a modest edge; this does not align with bullish derivatives sentiment. Put differently, directional preference is optimistic, but actual transactions have not confirmed it. This divergence means the rebound's durability still requires careful validation.
On the current daily basis, the daily quantity proxy for the covered BTC perpetual markets is 132.949 BTC, with a 30-day total of 10,480.220 BTC. This measure only describes the scale of pressure release in the covered markets and cannot represent real-time conditions across the entire market. The current daily figure is not large relative to the 30-day total, so the main risk is not a large forced unwind that has already occurred, but rather the possibility that crowded derivatives positioning amplifies volatility if price weakens again.
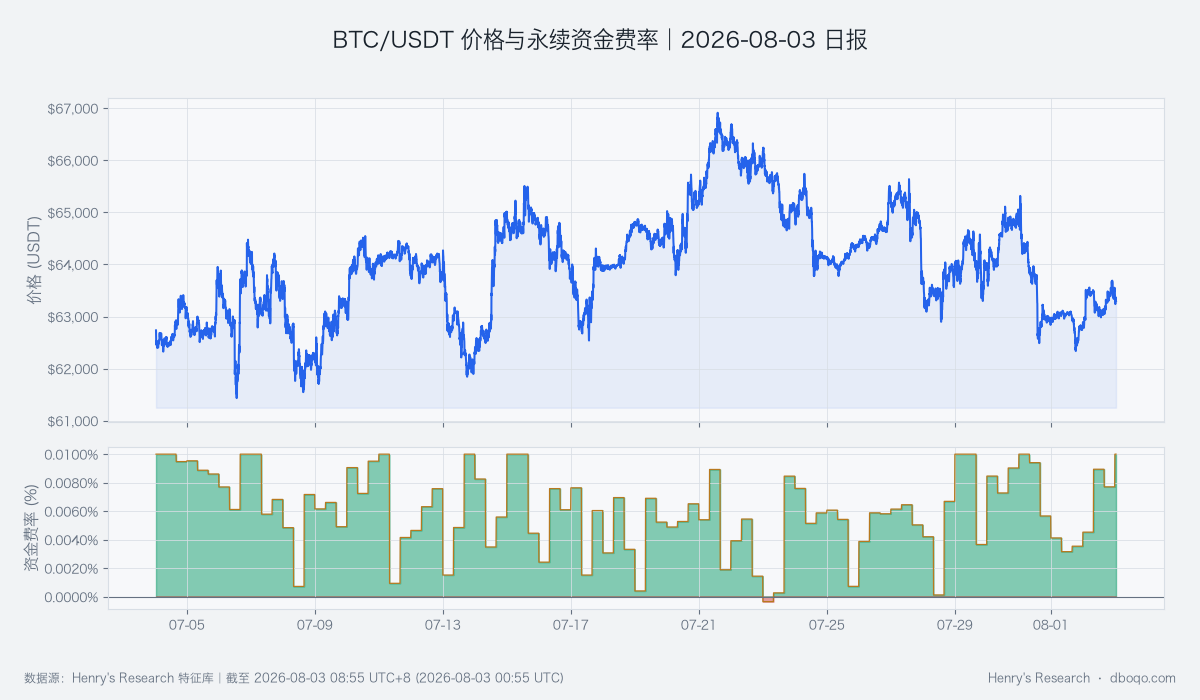
BTC/USDT 30-day price and perpetual funding rate
Cross-Market Environment
The US Dollar Index is 100.19 and VIX is 15.99. The dollar index reflects the dollar's strength against major currencies, and a stronger dollar often makes it harder for risk assets to attract incremental capital. VIX is commonly used to gauge risk aversion in traditional markets; its current level is not high, indicating that external fear has not risen materially. Together, they suggest that the macro environment is not creating an urgent shock, but it also does not resolve the crypto market's own liquidity contraction.
BTC's 30-day correlation with the S&P 500 is -0.0592, close to zero, indicating a weak recent relationship between the two. Therefore, BTC's next move cannot be inferred simply from equity-market gains or losses. The current assessment should rely more on BTC's own price structure, active trading, and fund flows. If the correlation rises materially later, changes in traditional-market risk appetite may again become a more important external condition.
Overall Assessment
Overall, the 0.78% gain over 24 hours is a positive change, and the low-volatility environment leaves room for further repair. However, price remains below both moving averages, active selling has the edge, ETF and stablecoin flows are contracting together, and derivatives show concentrated bullish positioning. The dominant evidence still points to strong overhead resistance. The opposing risk is that price reclaims the moving averages with volume confirmation, turning the current rebound into a more reliable recovery.
Directional view: Bearish. This is a conditional conclusion based on current evidence, led by resistance from both moving averages, stronger active selling, and contracting off-market flows. The 24-hour rebound and low external fear provide a cushion, but do not mean price must fall.
Assessment horizon: The next 1 to 3 days. Conditions for validity: Price remains capped by the 63,936.52 to 64,090.84 USDT area, active transactions continue to favor selling, and ETF and stablecoin flows do not improve. Invalidation conditions: Price holds above 64,090.84 USDT on stronger volume, active buying regains the lead, and derivatives heating is not accompanied by further basis weakness.
Risk Notice
Price remains within its recent range, and both advances and declines can be amplified by liquidity and concentrated derivatives positioning. Readers should observe whether price holds key zones, whether volume confirms the move, and whether fund flows shift from contraction to improvement; no single measure is enough to confirm direction. ETFs, stablecoins, and cross-market correlation provide conditional clues rather than certain causal explanations.
Disclaimer: All data in this report comes from the dboqo feature store, as of 2026-08-03 08:55 UTC+8. Cryptocurrency markets are highly volatile. This report is only an objective analysis of market conditions and does not constitute investment advice. Investors must assess risks independently and make prudent decisions.