One. Core Finding and Direction: A Wider Options Volatility Premium Meets Limited Support from Warmer Capital
Data context: Data are current through 2026-08-14 09:20 UTC+8. The current window covers the preceding 24 hours, and the historical comparison uses 180 comparable 24-hour periods aligned to the same cutoff time. Core finding: Options are pricing substantially more future volatility than spot has recently realized. This shows that the market is paying a larger premium for a possible breakout. Meanwhile, cross-market conditions are warm and active buying has improved slightly, but price remains below two daily moving averages and volume is insufficient to confirm a breakout. Historical comparison: The implied-versus-realized volatility spread is +7.54 versus a historical mean of -2.01; only about 8 of the 180 comparable periods were higher, placing it at a rare high. The premium alone does not determine direction, but it indicates that price is becoming more sensitive to new information. Scope check: All 13 quality checks passed. No unit, frequency, or magnitude anomalies were found, and there were no scope-anomaly candidates requiring exclusion from the directional assessment. Directional view: Bullish, but conditional on confirmation from volume. Assessment horizon: The next 24 hours. Conditions for validity: Price must first hold 62,800.00 USDT, then recover above 64,211.38 USDT while volume and active buying continue to improve. Invalidation conditions: A break below 62,800.00 USDT, or a further rise in funding while spot buying weakens, would invalidate the bullish view and restore downside risk.
Two. Key Market Data: Price Edges Higher While Volume Remains Below Its Historical Norm
BTC/USDT stands at 63,520.10 USDT, up +0.16% over the past 24 hours, within a range of 62,800.00 to 63,990.70 USDT. The gain is near the historical midpoint, indicating a weak recovery after a dip rather than trend acceleration. Volume totaled 121,144 BTC, below the historical mean of 159,663 BTC and lower than about 71% of comparable periods. The recovery therefore still lacks conviction. The key next observation is whether volume expands as price tests 63,990.70 USDT, rather than the price change alone.
Three. Price Behavior and Trend: The Two Moving Averages Remain the Rebound Confirmation Threshold
Price remains below the 10-day moving average at 64,211.38 USDT and the 30-day moving average at 64,326.96 USDT. The two averages are close together, creating a concentrated resistance zone. This means the short-term recovery has not yet become a daily trend reversal. Only a sustained recovery above that area would upgrade the bullish signal from conditional to trend-confirmed. If price repeatedly fails there and returns toward 62,800.00 USDT, the move would look more like a weak rebound inside a range than the start of a new advance.
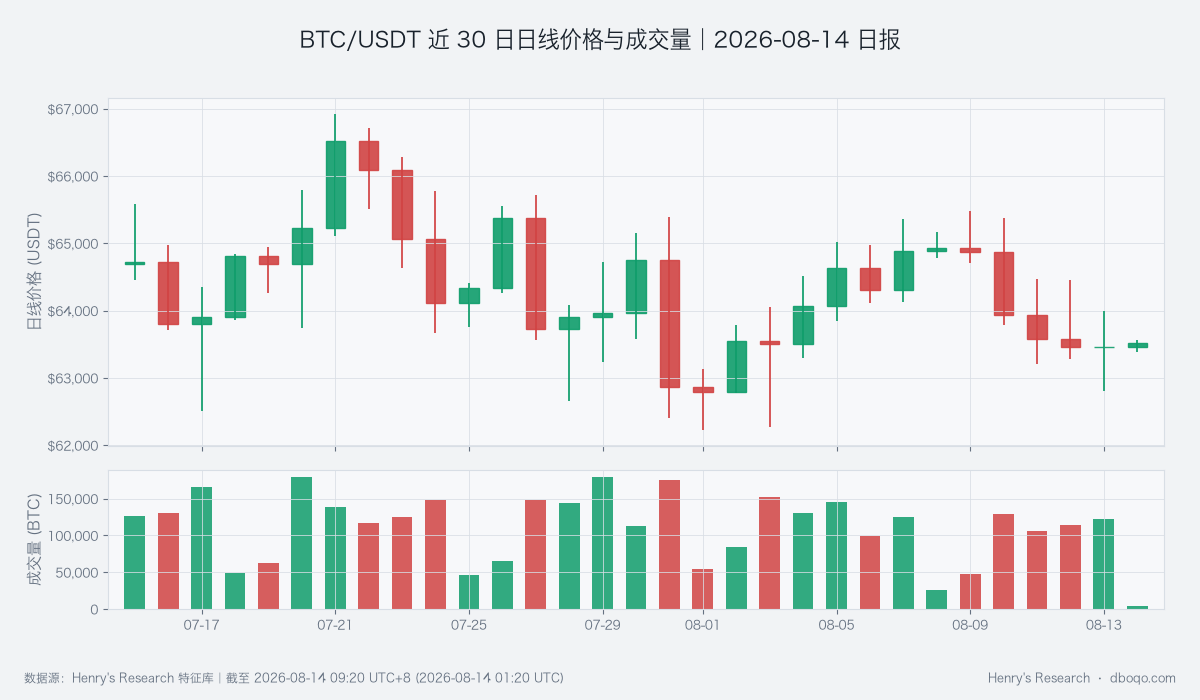
BTC/USDT 30-day daily price and volume; the two-moving-average zone remains the rebound confirmation threshold.
Four. Price-Volume Structure and Price Range: Active Buying Improves as Compression Awaits a Breakout
The cumulative slope of active buying minus active selling is +44 BTC, compared with a historical mean of -16 BTC and higher than about 63% of comparable periods, indicating that demand is beginning to appear below the market. The improvement is not yet large enough to offset low total volume. The price-range amplitude is +0.39%, versus a historical mean of +1.31%; only about 7 of the 180 comparable periods were equally low or lower, marking an unusually compressed market. This combination supports a buildup but does not predetermine an upside breakout. The next test is whether buying expands together with the trading range.
Five. Derivatives Anomaly: A High Volatility Premium Coexists with More Expensive Long Exposure
The options volatility premium is the strongest finding this period. The implied-versus-realized volatility spread rose to +7.54, compared with a historical mean of -2.01, showing that investors are much more guarded against future price movement than recent realized volatility would suggest. The average perpetual funding rate over the past 24 hours was +0.007328%, above its historical mean of +0.001765%; only about 14 of the 180 comparable periods were higher, putting long holding costs at a rare high. Together, these measures show a market betting on a breakout while paying more for bullish exposure. If spot volume does not follow, crowding could amplify a move in the opposite direction.
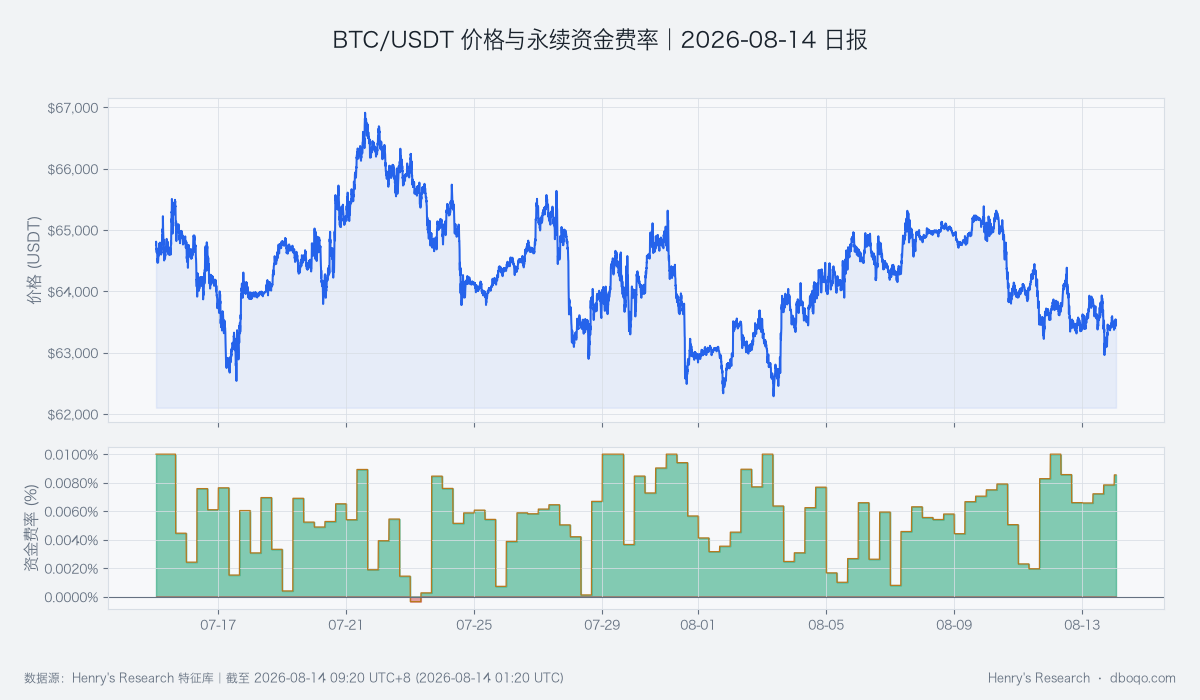
BTC/USDT 30-day price and perpetual funding rate; the cost of holding long exposure is at a rare high.
Six. Cross-Market and Capital Conditions: Risk Appetite Improves but Incremental External Demand Remains Limited
The BTC cross-market capital temperature is warm. The VIX risk-appetite measure is -1.82, versus a historical mean of +0.04; only about 1 of the 180 comparable periods was equally low or lower. The dollar-index deviation is -0.99, below about 82% of comparable periods. These conditions usually reduce external pressure on risk assets. However, 5-day ETF flows still show a net outflow of 9,620 ten-thousand-dollar units, while 30-day stablecoin supply growth is -0.82%, indicating that incremental external capital readily convertible into BTC demand remains insufficient. Capital conditions therefore support the rebound setup without providing enough evidence for a one-way advance.
Seven. Composite Signal and Scenario Validation: The Bullish Consensus Still Needs a Spot Breakout
The composite signal is bullish, consistent with improving active buying, low VIX, and a softer dollar, but it conflicts with below-normal volume and price remaining beneath the two moving averages. The base case is for price to consolidate between 62,800.00 and 64,326.96 USDT before testing higher. Confirmation would be a volume-backed recovery above 64,326.96 USDT. The counter-scenario is persistent high funding, weakening spot demand, and a break below 62,800.00 USDT. If that occurs, the view should be overturned, and the options volatility premium would be more likely to be realized through downside volatility.
Eight. Risk Notice
The main uncertainty is the direction of the elevated volatility expectation. The low-volatility compression may end quickly, while high funding can magnify adjustments in crowded positions. ETF and stablecoin data describe the capital environment and do not imply that funds must flow into BTC immediately. Changes in VIX and the dollar should also be interpreted conditionally, not as deterministic causes. The daily quantity proxy for the covered BTC perpetual markets measures only localized forced-liquidation pressure and does not represent the entire market. Any breakout should continue to be checked for joint confirmation from volume, active buying, and external capital.
Disclaimer: This report was prepared by dboqo based on market data available through 2026-08-14 09:20 UTC+8. Cryptocurrency markets are highly volatile. This report provides objective analysis of market conditions only and does not constitute investment advice. Investors must assess risks independently and make prudent decisions.