Core Finding and Direction: Option volatility is rising, but price and volume have yet to confirm a breakout
Data context: Data are through 2026-08-15 09:20 UTC+8. The current window covers the latest 24 hours ending at that time and is compared with 180 historical 24-hour samples aligned to the same cutoff. Core finding: The premium of option-implied volatility over recent realized volatility widened to +7.88, versus a historical mean of -1.88; only about 7 of 180 comparable periods were higher. This means the market is paying more for potential volatility, but direction is not confirmed because BTC fell 0.80% while volume was only 103,349 BTC. Historical comparison: Current volume was below the historical mean of 159,702 BTC and lower than about 78% of comparable periods, showing that the price move lacks broad participation and needs stronger volume to validate a breakout. Scope check: All 13 quality checks passed, with no unit, frequency, or magnitude anomaly and no scope-anomaly candidate requiring exclusion from the directional assessment.
Directional view: Range-bound. Time horizon: The next 24 hours. Conditions for validity: Price remains within 62,484.20 to 63,595.10 USDT, volume stays below normal, and active buying plus the warmer capital backdrop limit the downside. Invalidation conditions: A volume-backed move above 63,595.10 USDT would shift the view bullish; a volume-backed break below 62,484.20 USDT, or a clear weakening in active buying, would shift it bearish.
Key Market Data: Price retreated while trading participation remained limited
BTC traded at 63,014.90 USDT, down 0.80% over the past 24 hours, versus an average historical decline of 0.03% over comparable windows; the current result was lower than about 68% of comparable periods, weak but not disorderly. More importantly, volume of 103,349 BTC was roughly one-third below the historical mean of 159,702 BTC. The price fell without a volume surge, meaning sellers had the edge but broad-based selling pressure had not formed; watch for volume expansion near the lower boundary.
Price Action and Trend: Intraday momentum remains firm, while daily pressure persists
The daily price remained below the 10-day average of 64,105.33 USDT and the 30-day average of 64,270.08 USDT, while daily RSI stood at 42.76. RSI gauges directional momentum, and a reading below 50 shows that the medium-term recovery remains incomplete. However, intraday RSI reached 61.79, with only about 18 of 180 comparable periods higher, showing that short-term buyers have not fully withdrawn. The conflict between time frames makes a sustained hold above 63,595.10 USDT more important than a single rebound.
Price-Volume Structure and Range: Active buying supports price near the upper boundary
Price is near the upper part of its recent swing, with only about 7 of 180 comparable periods positioned higher. Yet the swing amplitude was only 0.43%, versus a historical mean of 1.31%, and only about 12 comparable periods were equally low or lower, showing that the market is compressed into a narrow range. The cumulative slope of active buying minus active selling was +135 BTC, versus a historical mean of -15 BTC, higher than about 87% of comparable periods. Buying support is real but has not produced a volume-backed breakout; the next test is whether active buying strengthens as price challenges the upper boundary.
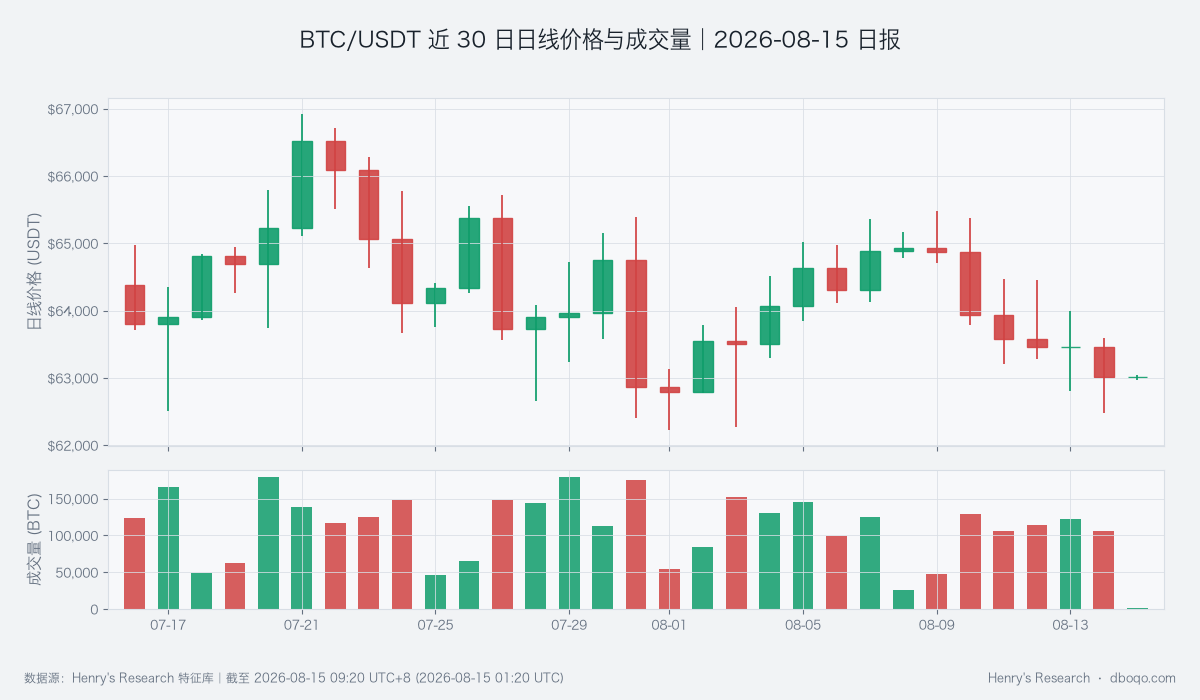
BTC/USDT daily price and volume over the past 30 days, showing whether price and volume jointly confirm a breakout.
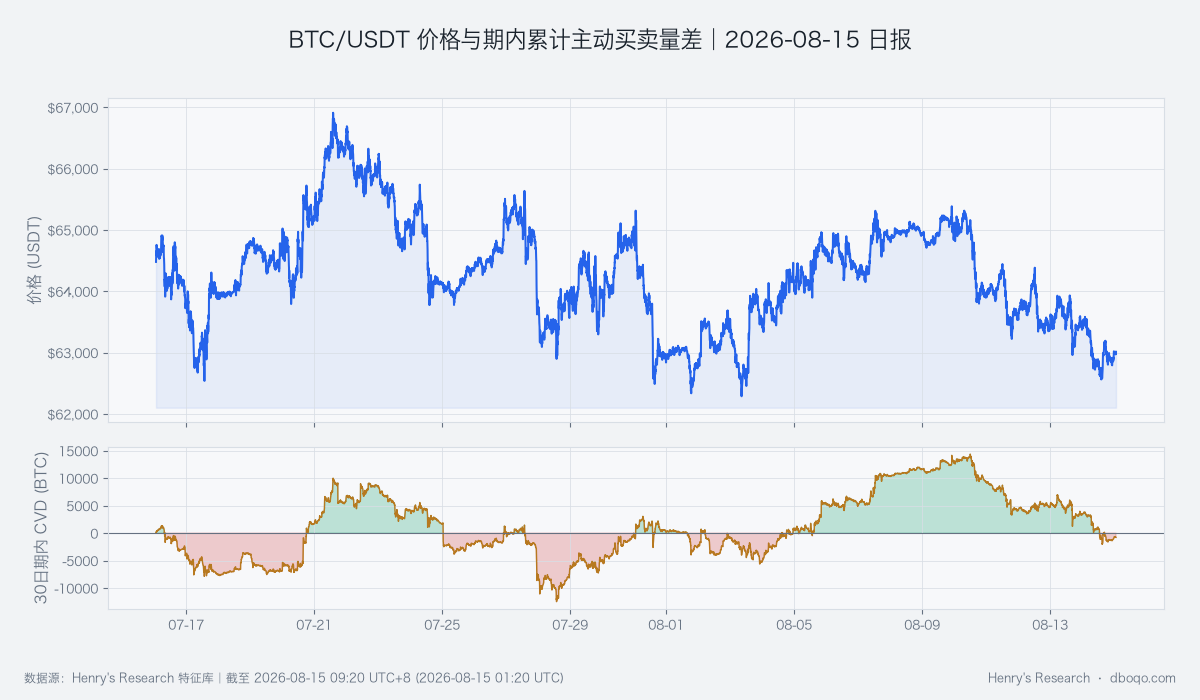
BTC/USDT price and cumulative active buying minus active selling over the past 30 days, showing whether buyer support can persist.
Derivatives Anomaly: Option-volatility premium and long-side crowding are rising together
Implied volatility reflects the option market's pricing of future price swings. Its spread over recent realized volatility reached +7.88, well above the historical mean of -1.88, indicating warmer risk pricing. At the same time, the long-short deviation was +1.60, versus a historical mean of -0.05 and higher than about 88% of comparable periods. The average funding rate over the latest 24 hours was +0.004955%, also above its historical mean of +0.001804%. A stronger long bias without price and volume confirmation means an upside break may attract crowded chasing, while a break below the range could trigger faster position unwinding.
Cross-Market and Capital Conditions: The macro backdrop is warm, but direct capital remains weak
BTC cross-market capital temperature is warm. VIX was 14.64, indicating low expected volatility in US equities, while the US Dollar Index was 99.76, signaling relatively mild dollar pressure; both conditionally support risk assets. However, ETF flows still showed a net outflow of USD 3.29 hundred million over the past 5 days, versus a historical mean net outflow of USD 0.77 hundred million. Stablecoin supply growth over 7 and 30 days was -0.07% and -0.88%, respectively, showing that capital directly available to the crypto market is not expanding in step. The macro backdrop may cushion declines, but it cannot by itself prove that BTC will continue higher; watch whether ETF flows and stablecoin supply improve.
Composite Signal and Scenario Validation: Support and pressure broadly offset each other
The composite signal is range-bound and broadly consistent with the current price-volume and capital evidence: active buying, low VIX, and a softer dollar provide support, while the price decline, light volume, ETF outflows, and derivatives crowding add pressure. If volume returns toward 159,702 BTC and price holds above 63,595.10 USDT, broader participation would be confirming buyers and invalidate the range-bound view in favor of a bullish scenario. If price breaks below 62,484.20 USDT while active buying minus active selling weakens, support would be failing and bearish risk would dominate.
Risk Notice
The option-volatility premium is at a rare high, meaning the market may be underestimating an approaching price swing; light volume can also amplify short-lived news shocks. Relationships among ETF flows, stablecoins, the dollar, and VIX are conditional rather than deterministic, and range boundaries can be crossed quickly.
Disclaimer: This report was prepared by dboqo using market data through 2026-08-15 09:20 UTC+8. Cryptocurrency markets are highly volatile. This report provides objective analysis of market conditions and does not constitute investment advice. Investors must assess risks independently and make prudent decisions.