I. Core Finding and Direction: Downside Risk Has a Slight Edge After Volatility Compression
Data basis: As of 2026-08-16 09:25 UTC+8, the current observation window covers the preceding rolling 24 hours. Historical comparisons use 180 rolling 24-hour samples aligned to the same cutoff time, keeping market hours and statistical definitions consistent.
Core finding: Both realized BTC volatility and trading volume have fallen to rare lows, while the options premium over realized volatility has risen to an unusually high level. This means the market is paying more for a future volatility expansion, but spot trading has yet to confirm the direction. Price remains below the 10-day and 30-day moving averages, while ETF flows over the past 5 days are negative, so downside risk currently has a slight edge when compression ends.
Historical comparison: The 48-period realized volatility measure, which captures the magnitude of recent price changes, stands at +0.03%, versus a historical mean of +0.12%. Among 180 comparable periods, only about 1 was as low or lower. This means the current calm is no longer routine. Its importance is that low volatility rarely persists indefinitely, so the next point to watch is whether any break is confirmed by trading volume.
Scope check: All 13 data-quality checks passed. No unit, frequency, or magnitude anomaly was found, and there are no scope-anomaly candidates that need to be excluded from the directional assessment. The rare readings are therefore treated as market behavior, not replaced with a data-error explanation.
Directional view: Bearish, but this is a conditional view before volatility is released and does not mean price has already broken down. Assessment horizon: The next 24 hours. Confirmation condition: Price remains capped below 63,170.00 USDT and breaks 62,890.20 USDT as volume expands. Invalidation condition: Price breaks above 63,170.00 USDT on stronger volume and then reclaims the 10-day moving average at 63,947.33 USDT.
II. Key Market Data: A Flat Price Masks a Sharp Contraction in Volume
BTC trades at 63,025.20 USDT, up just +0.02% over the past 24 hours and close to the middle of its historical range, so price alone has not established a strong trend. Yet trading volume is only 24,586 BTC, compared with a historical mean of 159,434 BTC; among 180 comparable periods, only about 1 was as low or lower. Such weak participation leaves the current range without reliable follow-through. Any move above 63,170.00 USDT or below 62,890.20 USDT must be accompanied by higher volume to carry lasting significance; otherwise, it is more likely to be a false break within a narrow range.
III. Price Action and Trend: Pressure From Both Moving Averages Remains
The current price of 63,025.20 USDT is below the 10-day moving average at 63,947.33 USDT and the 30-day moving average at 64,245.17 USDT, showing that short- and medium-term trend pressure remains overhead. A near-flat price over the past 24 hours does not mean the trend has recovered, because the key question is whether BTC can reclaim the first moving-average barrier and hold above it. If rebounds continue to fail, low volatility is more likely to end with a search for liquidity lower down. If price reclaims both moving averages in sequence, the bearish view should be materially reduced.
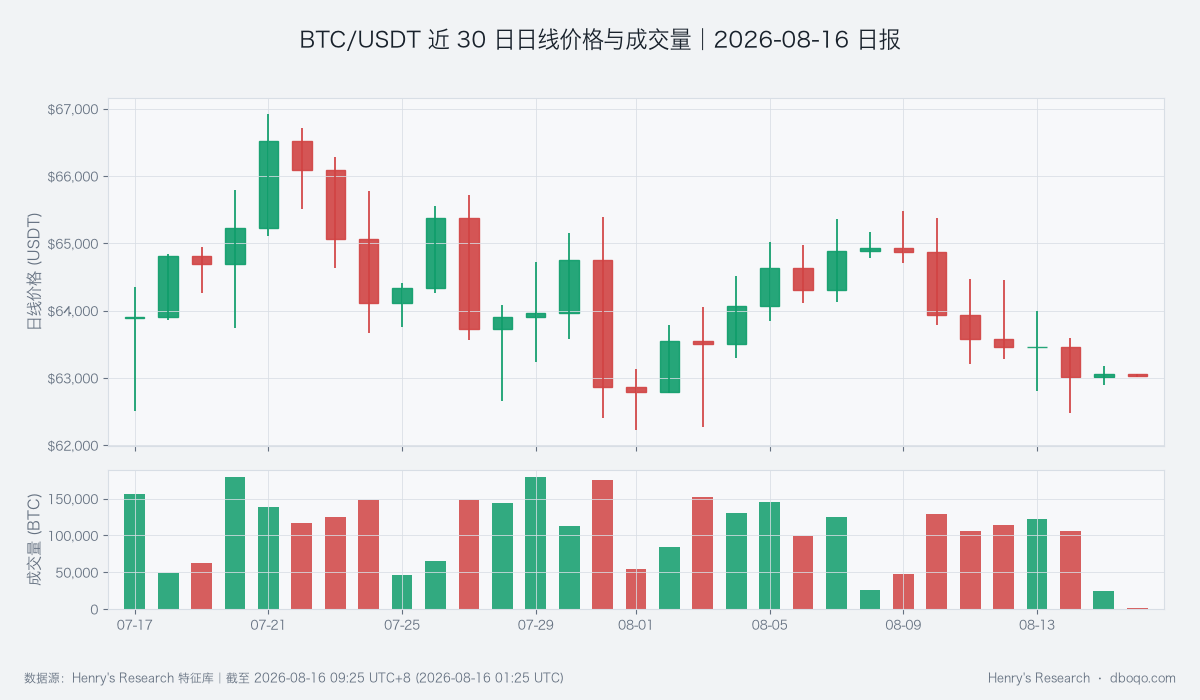
BTC/USDT 30-Day Daily Price and Trading Volume
IV. Price-Volume Structure and Range: Stronger Aggressive Buying Lacks Broad Volume Confirmation
Aggressive net-buying strength is +0.79, compared with a historical mean of only +0.02; among 180 comparable periods, only about 16 were higher. This shows a genuine improvement in short-term buyer initiative and is the most important counterpoint to the bearish view. However, price remains confined to the narrow 62,890.20-63,170.00 USDT range, while total trading volume is extremely low, meaning small orders can amplify indicator movements. If stronger aggressive buying lifts total volume and clears the upper boundary, this counterpoint would become evidence of trend repair. If buyer strength fades as the lower boundary breaks, it would show that support is insufficient.
V. Derivatives Anomaly: The Options Premium Is Pricing Volatility Expansion Early
The implied-versus-realized volatility spread is +8.76, compared with a historical mean of -1.76; among 180 comparable periods, only about 3 were higher. This measure captures the premium in options pricing for expected volatility relative to recent realized volatility. Its rare high indicates that traders are paying a substantial premium for future movement, but it signals only that volatility may expand and does not determine direction on its own. At the same time, the average funding rate over the past 24 hours is +0.005847%, above the historical mean of +0.001828% and higher than about 82% of comparable periods, showing elevated financing costs for long exposure. If price cannot break higher while funding remains elevated, downside-release risk will rise; if spot trading strengthens on higher volume, the premium could instead resolve through an upside expansion.
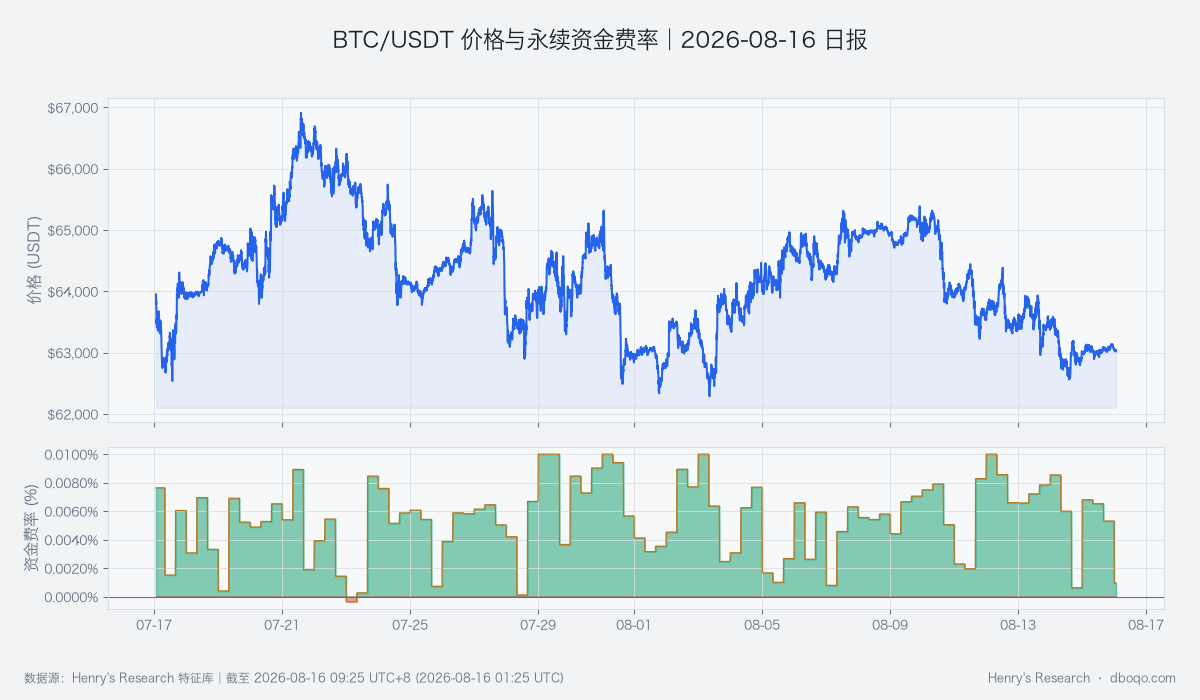
BTC/USDT 30-Day Price and Perpetual Funding Rate
VI. Cross-Market and Capital Conditions: Neutral Conditions Offer No One-Way Support
The BTC cross-market capital pulse is neutral (+0.27), meaning ETF flows, stablecoin supply, the US dollar, and market-volatility factors offset one another rather than forming a unified capital impulse. ETFs recorded a net outflow of 2.97 hundred million USD over the past 5 days, versus a historical mean net outflow of 0.76 hundred million USD. Although still within a routine range, this shows that off-exchange demand is not providing a clear follow-through. Stablecoin supply growth over 7 days and 30 days is -0.10% and -0.84%, respectively, indicating marginally weaker liquidity available to enter crypto markets. On the other hand, subdued pressure from the US dollar and VIX risk measure provides some cushion for risk assets. Crucially, these conditions show only that the capital environment is not extreme; neutral conditions cannot be treated as a guaranteed floor. The next test is whether ETF flows and stablecoin supply improve together.
VII. Combined Signal and Scenario Test: The Bearish View Awaits Confirmation From a Range Break
The combined signal is bearish and broadly aligned with public evidence from price below both moving averages, extremely low trading volume, ETF outflows, and contracting stablecoin supply. Strong aggressive net buying and a relatively benign macro risk environment are the key opposing constraints. The current view therefore does not chase a static price; it waits for the direction chosen after compression. The base case is continued pressure below 63,170.00 USDT followed by a test of 62,890.20 USDT as volume returns. A break of the lower boundary alongside weaker aggressive buying would confirm the bearish view. Conversely, a higher-volume break above the upper boundary, followed by a recovery of the 10-day moving average and improving capital conditions, would overturn the view and shift the outlook toward a range-bound recovery.
VIII. Risk Notice
Extremely low volatility means the risk of sharp moves is building in both directions. The options premium reflects pricing for volatility expansion but cannot forecast the direction of the break, while the rare improvement in aggressive buying can reverse quickly in a low-volume environment. Macro news, a single-day change in ETF flows, or a shift in liquidity can invalidate the range conditions. Trading volume, range boundaries, and recovery of the moving averages should be assessed together rather than extrapolating any single measure into a certain outcome.
Disclaimer: This report was prepared by dboqo based on market data as of 2026-08-16 09:25 UTC+8. Cryptocurrency markets are highly volatile. This report is solely an objective analysis of market conditions and does not constitute investment advice. Investors should assess risks independently and make prudent decisions.