I. Core finding and direction this week: the volume-contracted decline leaves any rebound without capital confirmation
Data scope:The statistical window covers the complete UTC calendar week from 2026-8-10 00:00 to 8-17 00:00, with data through Beijing time 8-17-07 55; the full week includes 2,016 5-minute market observations and is compared with 104 complete comparable weeks using the same aggregation method.
Core finding:BTC declined 3.07% this week, falling from 64,867.80 USDT to 62,876.00 USDT, while total volume was only 642,355 BTC, about half its historical mean. The price weakness is consistent with capital contraction, indicating insufficient buyer support; at the same time, exceptionally low volume suggests the market is closer to a low-volume drift lower than a broadly traded, accelerating breakdown. The most important observation next week is not price rebounding alone, but whether a rebound is accompanied by simultaneous improvement in volume and capital flows.
Historical comparison:The average gain for comparable weeks was 0.29%, and this week performed below about 73% of comparable weeks; historical average volume was 1,275,814 BTC, and among 104 comparable weeks, only about 2 were as low or lower than this week. 48-period realized volatility measures the magnitude of actual price swings; this week’s average was 0.06%, versus a historical average of 0.12%, with only about 1 of 104 comparable weeks at the same or lower level. Low volume, low volatility, and a decline occurring together imply a weak direction, but not yet a high-participation, consensus sell-off.
Methodology review:Price, volume, liquidations, capital, and cross-market indicators are each handled at their original frequencies and use the same units and statistical methods as historical weeks; no candidates for unit, frequency, or magnitude anomalies were found this week, so no indicators were excluded for methodology reasons.
Directional assessment:Bearish. Bearish evidence outweighs bullish evidence among the research factors, while the composite signal is range-bound and does not offset the combined pressure from the price decline, aggressive selling, and capital contraction.Assessment horizon:The next calendar week.Conditions for this view:Price remains capped by the 63,947.33 to 64,245.17 USDT area of the 10-day and 30-day moving averages, while volume fails to recover and stablecoin supply growth and ETF flows remain weak.Invalidation conditions:Price regains and holds above 64,245.17 USDT, with expanding volume, sustained aggressive buying dominance, and capital indicators strengthening in parallel.
II. Historical comparison and key anomalies: exceptionally low participation increases directional uncertainty
This week’s most important historical deviation is not the decline, but participation. Weekly volume of 642,355 BTC was about 633,459 BTC below the historical mean of 1,275,814 BTC, and only about 2 comparable weeks were similarly weak. This means the 3.07% decline lacks volume confirmation: sellers have the upper hand, but follow-through is limited. If price continues lower next week alongside a clear recovery in volume, the bearish assessment will strengthen; if price stabilizes and volume recovers, the low-volume decline is more likely to reflect a temporary liquidity contraction.
The actual magnitude of price swings is also at a rare low: 0.06% is only half the historical mean of 0.12%. Low volatility does not automatically produce a rebound; it only indicates compressed market energy. Once volatility rises over the coming week, the direction may amplify quickly. Therefore, both the weekly low of 62,484.20 USDT and moving-average resistance at 64,245.17 USDT should be monitored. Any one-sided breakout needs volume confirmation to carry greater credibility than this week.
III. Price action and trend: the close remains below both moving averages, and recovery must still clear 64,245
Price traded between 62,484.20 and 65,373.60 USDT this week and ultimately closed at 62,876.00 USDT, near the lower end of the weekly range. The close was below both the 10-day moving average at 63,947.33 USDT and the 30-day moving average at 64,245.17 USDT, indicating that medium- and short-term pressure has not yet eased. Daily RSI was 43.12. RSI measures upward and downward momentum; it is below its neutral line but has not entered an extreme oversold zone, so there is neither strong trend confirmation nor sufficient evidence of an oversold reversal. Unless price first reclaims 63,947.33 USDT next week, any intraday rebound should still be viewed as a weak recovery.
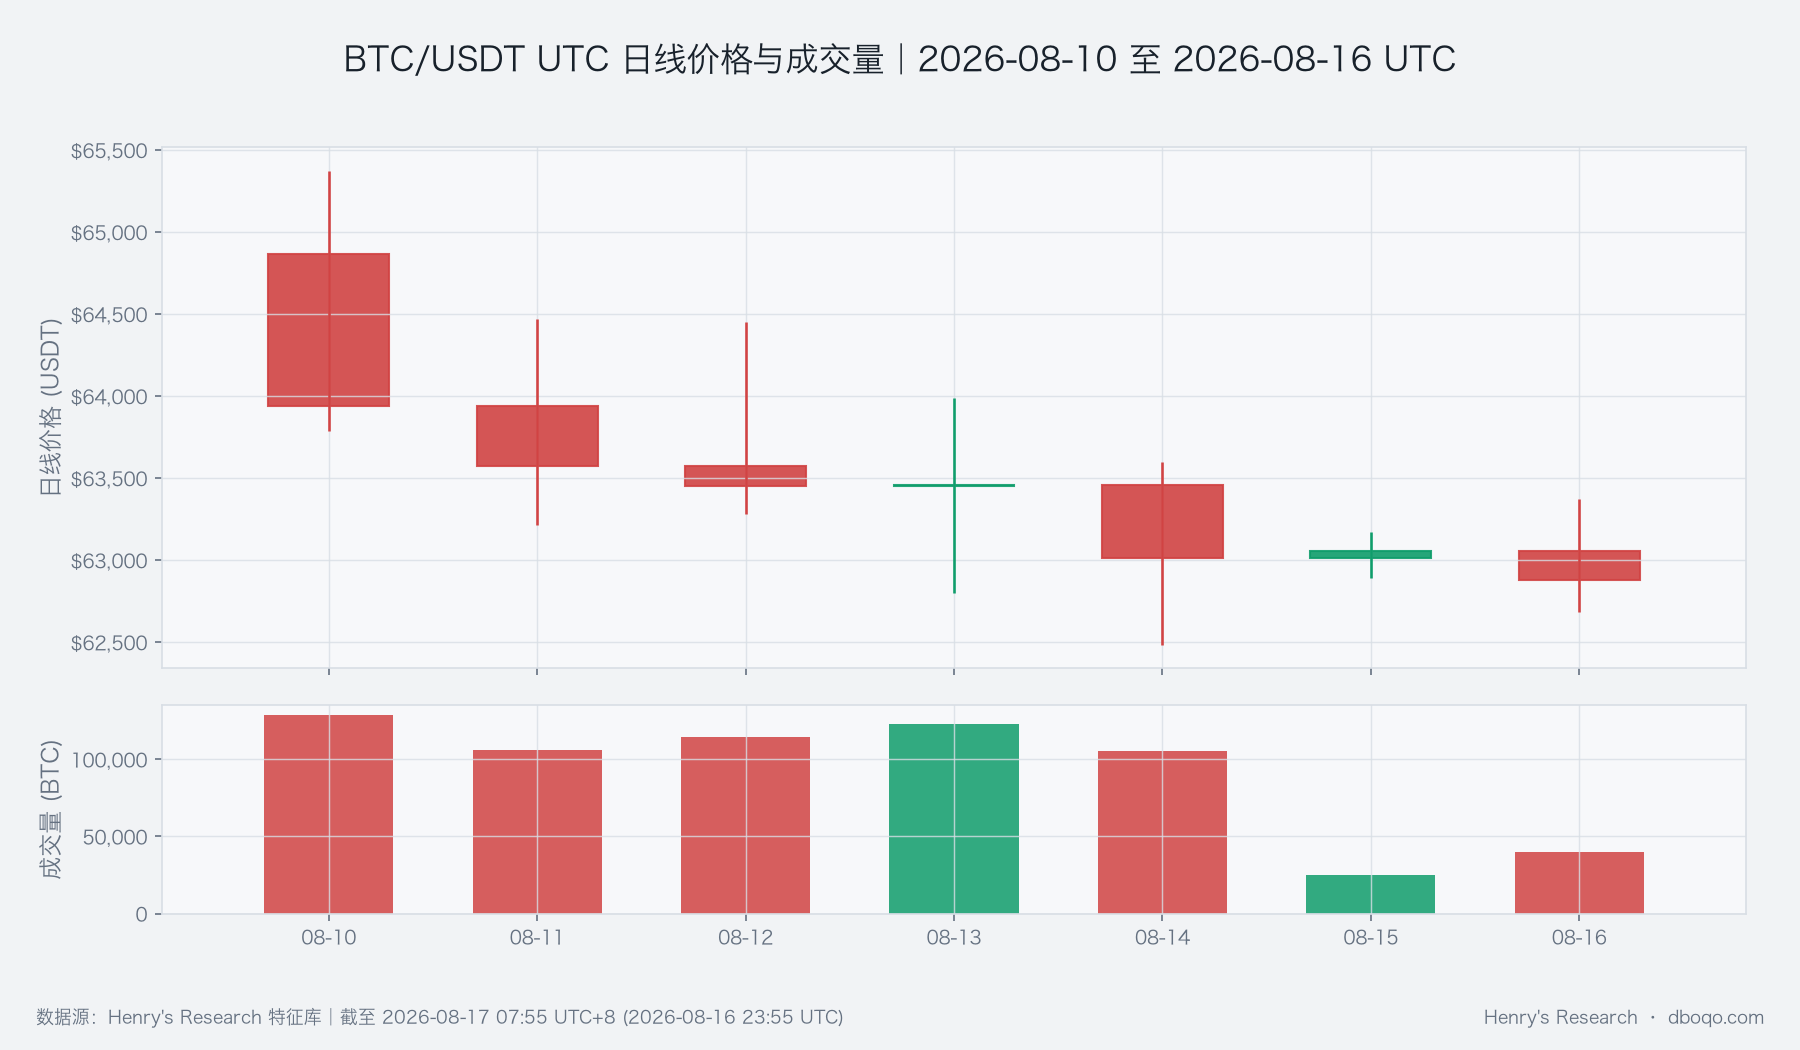
Price and volume in the chart together show that this week was not a typical high-volume breakdown. Why this matters: if selling pressure had reached broader consensus, volume would typically expand as price falls; that has not occurred. Next week, monitor whether volume simultaneously moves away from its low when price breaks 62,484.20 or 64,245.17 USDT.
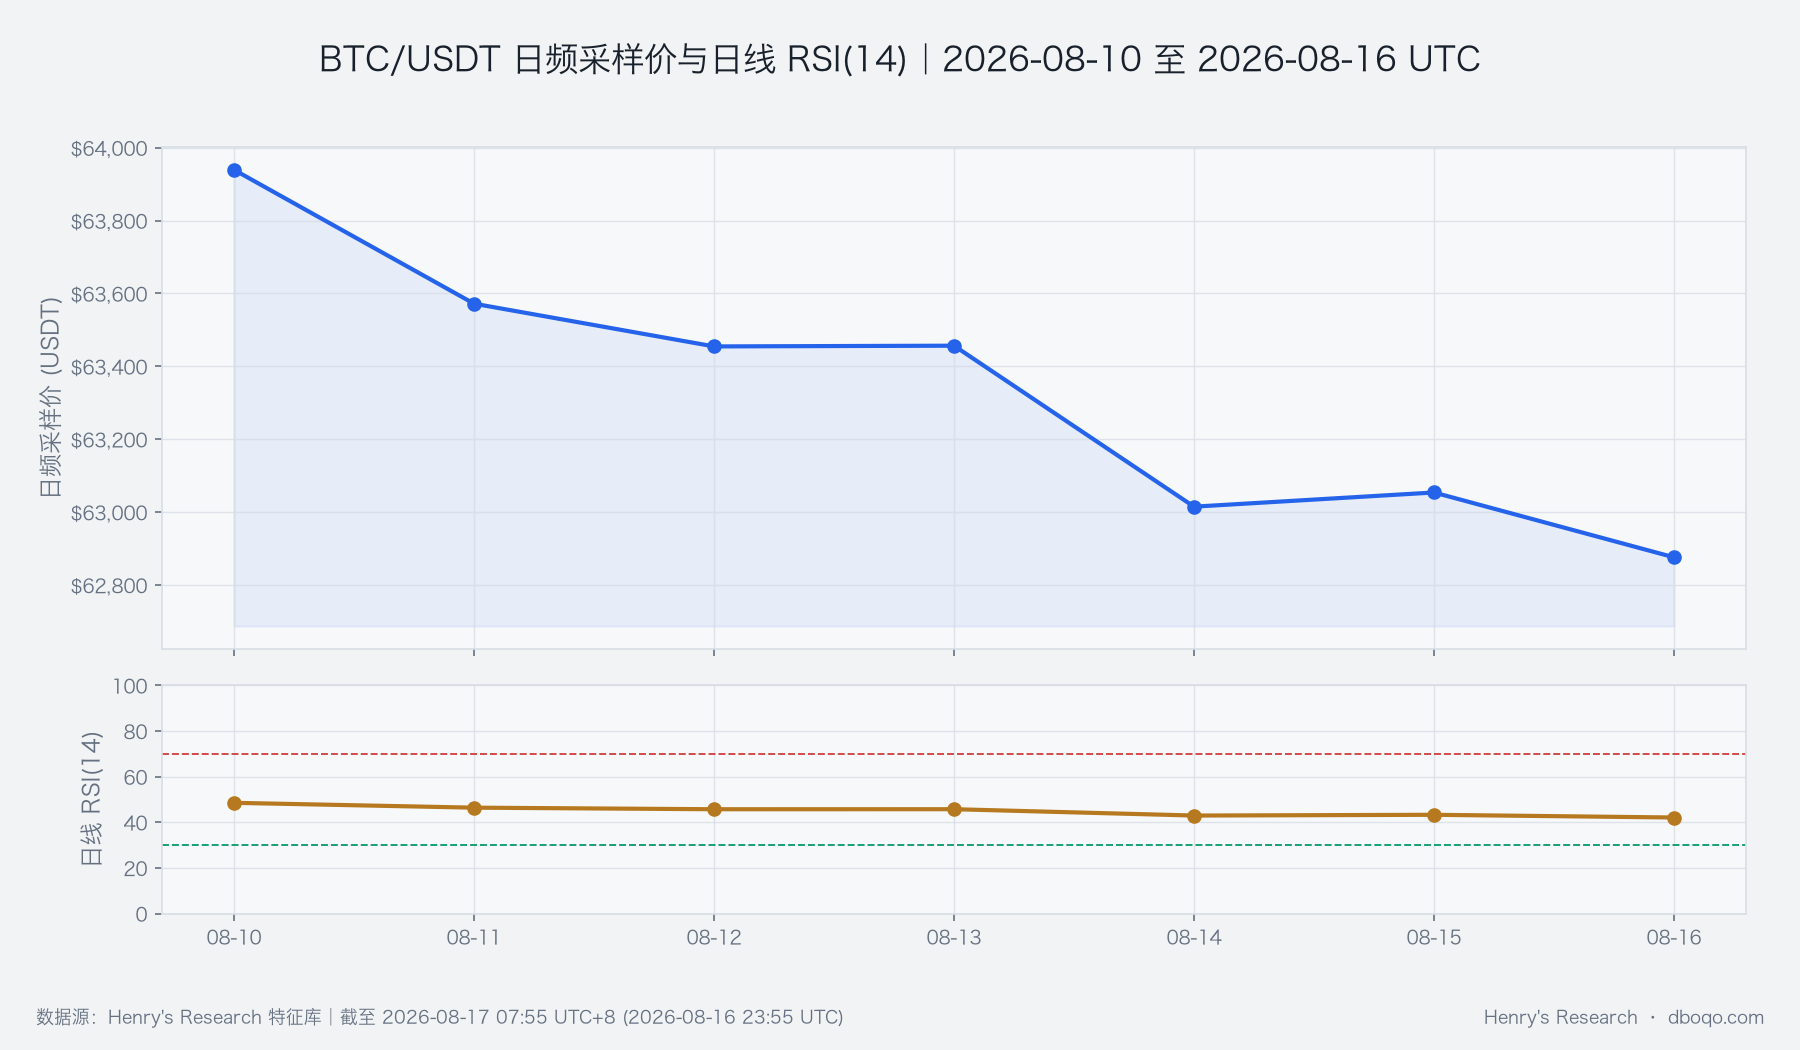
IV. Volume-price structure and price range: aggressive selling is stronger, but weekend buying provides a counterpoint
The cumulative slope of aggressive buying minus aggressive selling during the period was -31 BTC, versus a historical mean of +4 BTC, lower than about 77% of comparable weeks, indicating that aggressive trading overall favored sellers during the week. However, weekend aggressive net-buying intensity was 0.50, above the historical mean of 0.12 and higher than about 84% of comparable weeks, providing a counterpoint to a one-sided bearish view. Why this matters: the former explains the weekly weakness, while the latter indicates support at lower levels. If aggressive buying can persist next week and push price above the moving averages, the bearish assessment will weaken; if it turns negative again after only a brief recovery, weekend support will be insufficient to change the trend.
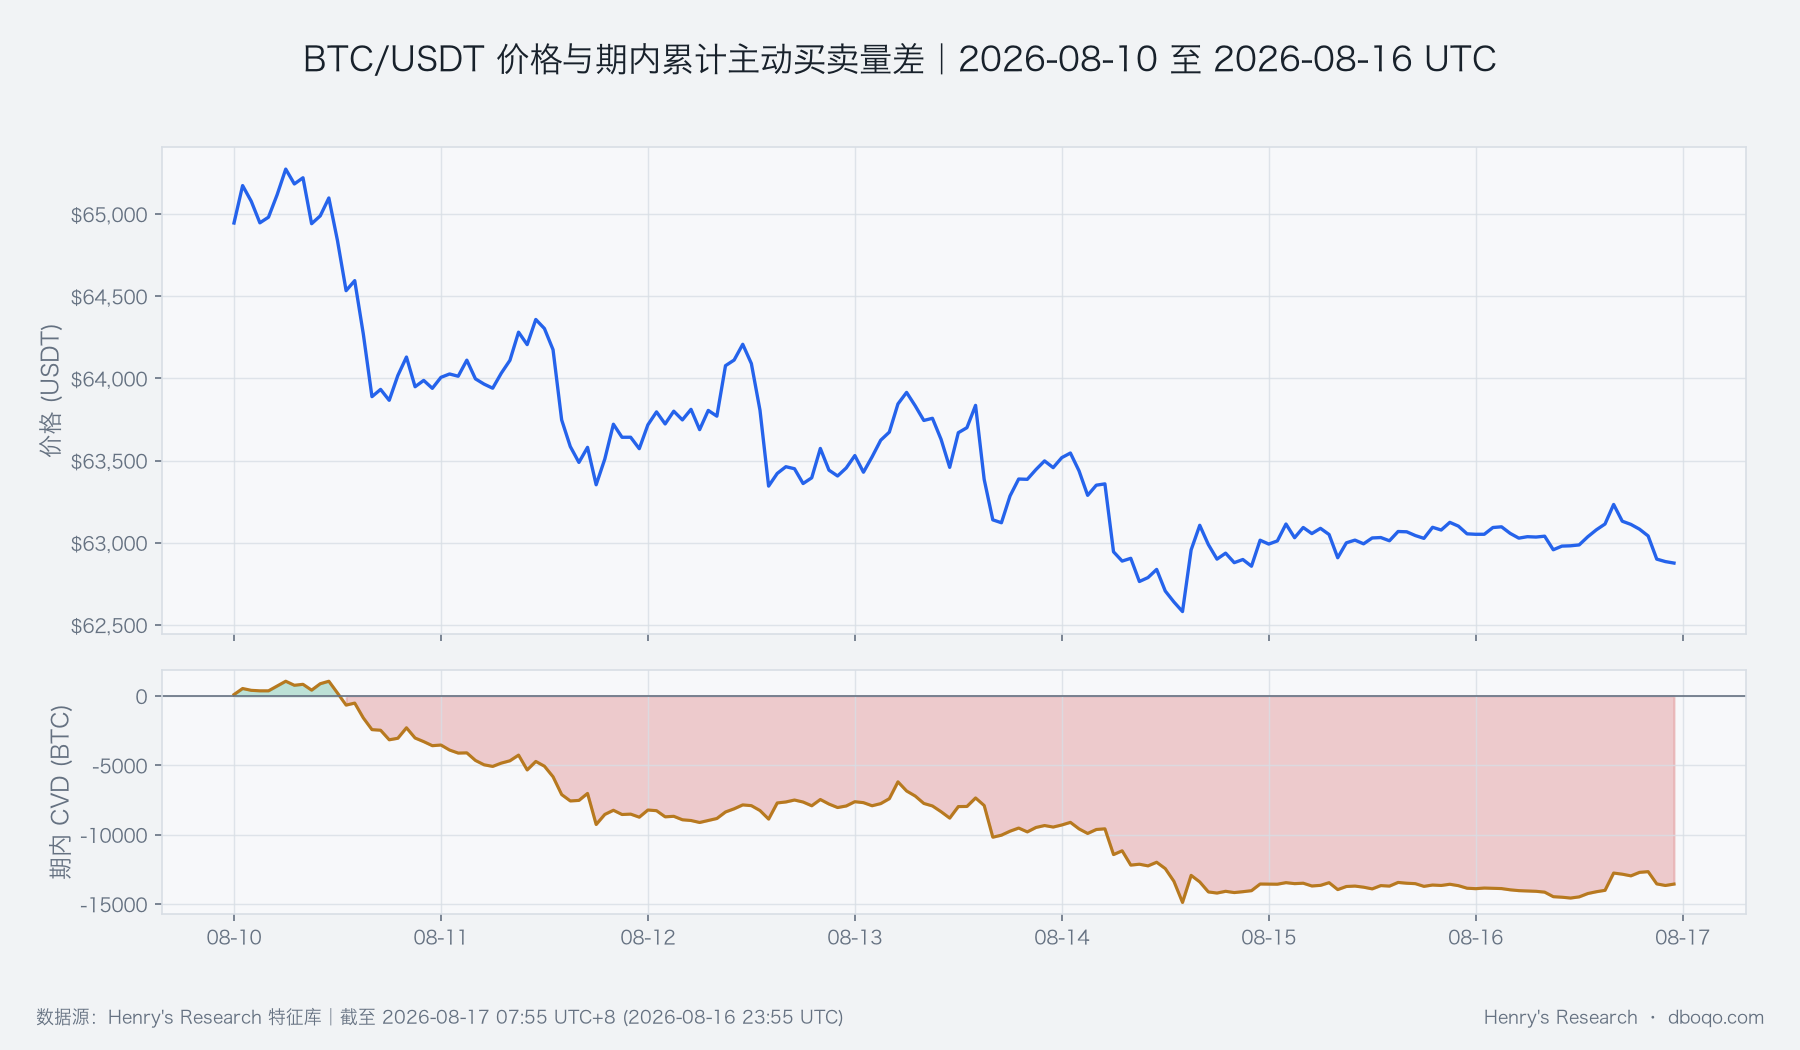
The current price is at approximately 0.44 of its recent price range, versus a historical mean of about 0.53; range amplitude was 0.71%, and only about 6 of 104 comparable weeks were equally narrow. A narrow range means both support and resistance are nearby, and a single touch does not constitute a breakout. Next week, focus on whether 62,484.20 USDT can hold, and whether there are consecutive closes above 64,245.17 USDT alongside expanding volume.
V. Derivatives anomalies: long bias has risen, while options still price volatility expansion
The long-short divergence was 1.31, versus a historical mean of only 0.04, higher than about 86% of comparable weeks, indicating that derivatives positioning is clearly tilted toward longs. Funding rate was 0.005782%, slightly above its historical mean of 0.004447%, but has not reached unusually crowded levels. Futures basis measures the premium or discount of contracts relative to spot; this week’s average was about -0.04%, close to the historical mean and showing no strong chase for price. Taken together, the three measures indicate long interest exists, but price and spot capital have not responded fully; if price continues to decline next week, the long tilt may instead increase pressure for forced position reductions.
Implied volatility reflects options-market pricing of future volatility, while realized volatility reflects volatility that has already occurred; their difference was 9.55, significantly above the historical mean of 2.37 and higher than about 86% of comparable weeks. The market is paying more for future volatility while actual volatility this week is extremely low; this contradiction suggests the range may expand next week. It does not indicate direction, so it must be assessed together with breakouts at 62,484.20 and 64,245.17 USDT and with volume.
VI. Cross-market conditions and capital flows: the macro environment is favorable, while on-market capital supply is still contracting
BTC’s cross-market capital temperature is neutral. VIX is 14.64, representing expected volatility in the equity market, and current risk pressure is at a rare low among 104 weeks; the dollar index is 99.76, which also does not present a clear headwind for risk assets. However, these daily and potentially lagging macro indicators can only show that the external environment has not deteriorated materially; they cannot directly explain BTC price moves. Meanwhile, ETFs saw net outflows of 2.97 hundred million USD over the past 5 days, versus a historical average net inflow of 3.36 hundred million USD; 30-day stablecoin supply growth was -0.84%, compared with a historical mean of +2.40%, lower than about 86% of comparable weeks. External risk appetite is relatively mild, yet it has not translated into BTC capital inflows; this is the central contradiction underlying this week’s bearish assessment.
Why this matters: ETF flows reflect part of traditional capital demand, while stablecoin supply reflects changes in liquidity available to the crypto market. They have different frequencies and may both lag, so they cannot simply be added together or treated as definitive causes of price movement. Only if ETFs turn to net inflows and stablecoin growth stops declining next week could capital conditions shift from neutral to supporting a rebound; if both continue to contract, BTC may still lack sustained fuel for upside even if VIX remains low.
VII. Composite signal and next-week scenarios: the bearish baseline holds, but a volume-backed breakout determines magnitude
The composite signal is range-bound and only partly consistent with volume-price evidence: it recognizes support from the long bias and lower macro risk, but does not overturn the weekly decline of 3.07%, stronger aggressive selling, and capital contraction. The baseline scenario is continued weak consolidation around 62,484.20 to 64,245.17 USDT; if price falls below 62,484.20 and volume recovers from rare lows, it would indicate stronger seller consensus and a potentially larger bearish move. Conversely, if price holds above 64,245.17 alongside continued aggressive buying, stronger ETF flows, and easing stablecoin contraction, the current assessment would be invalidated and the market could shift toward recovery.
A low-probability but important scenario is a sudden expansion in volatility while volume remains distorted: options already price higher volatility, and the extremely narrow range could break quickly. Observations should require simultaneous verification of three factors—price crossing a key boundary, recovering volume, and capital evidence moving in the same direction; without any one of them, a short-term breakout is insufficient to be elevated into a next-week trend.
VIII. Risk notice
This week’s assessment is based on complete calendar-week statistics, but liquidations, ETFs, stablecoins, VIX, and the dollar index have daily-frequency or lagging characteristics and cannot explain sudden intraday volatility. The current low-volume, low-volatility environment can also magnify the price impact of a small amount of trading, making false breakout signals more likely. Price, volume, and capital flows should continue to be checked for alignment, while consecutive closes beyond key ranges provide more reliable confirmation.
Disclaimer:This report is prepared by dboqo based on market data through 2026-08-17 07:55 UTC+8. Cryptocurrency markets are highly volatile. This report is only an objective analysis of market conditions anddoes not constitute any investment advice, and investors must assess risks independently and make prudent decisions.