I. Core Finding and Direction: Derivatives Heat and Capital Inflows Still Lack Breakout Confirmation
Data context: Data are current through 2026/8/24 09:05 (UTC+8). The current window covers the trailing 24 hours and is compared with 180 historical 24-hour samples aligned to the same cutoff time. Core finding: The average futures basis narrowed to -0.01%, meaning the futures discount to spot diminished sharply. Funding simultaneously rose to a rare high, while price advanced only modestly and total volume remained below its historical average, so spot demand has not confirmed the heat in derivatives. Historical comparison: The basis historical average is -0.05%, and only about 1 of 180 comparable periods was higher. This repricing is unusual, but it makes confirmation from price and volume more important; it is not sufficient on its own to establish an uptrend. Scope check: All 13 quality checks passed, with no unit, frequency, or magnitude anomalies and no scope-anomaly candidates that needed exclusion from the directional assessment. Directional view: Range-bound. Assessment horizon: The next 24 hours. Confirmation conditions: Price remains within 75,588.00 to 78,057.60 USDT and volume does not move materially above its historical average. Invalidation conditions: A high-volume hold above 78,057.60 USDT would shift the view bullish; a break below 75,588.00 USDT with weakening aggressive buying would make downside risk dominant.
II. Key Market Data: A Modest Price Gain Still Lacks Breakout Volume
BTC/USDT stands at 77,435.00 USDT, up 0.22% over the past 24 hours, with a high of 78,057.60 and a low of 75,588.00 USDT. The gain is close to historical norms, indicating that the market has not entered a one-way acceleration. The 24-hour turnover totaled 135,111 BTC, about 16% below the historical average of 160,614 BTC across 180 comparable periods. This matters because weaker aggregate demand near the range ceiling reduces the credibility of a breakout. The next test is whether volume can at least recover toward its historical average when price revisits 78,057.60 USDT.
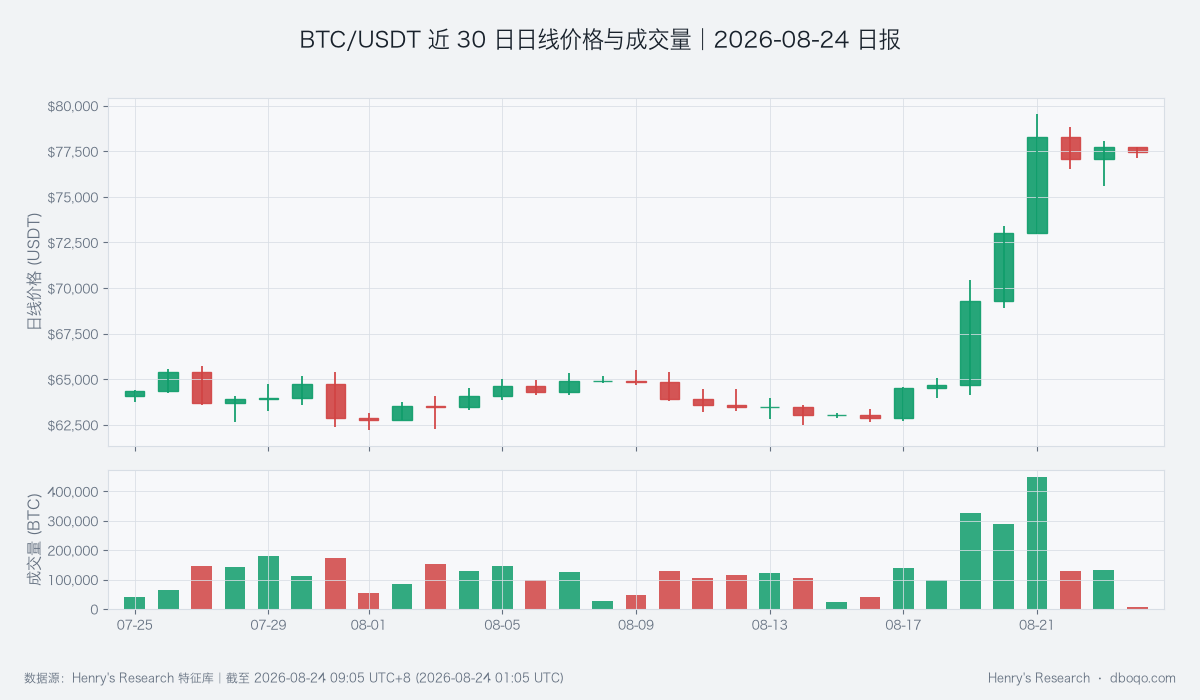
BTC/USDT 30-day daily price and volume, used to assess whether a price breakout receives volume confirmation.
III. Price Action and Trend: The Longer-Term Structure Is Firm, but Intraday Momentum Is Still Repairing
Price remains above the 10-day average at 69,356.44 USDT and the 30-day average at 65,814.14 USDT, so the medium-term advance has not broken down. However, the short-term moving-average spread is -74.62 USDT versus a historical average of +6.16 USDT, lower than about 75% of comparable periods and indicative of weak intraday trend conditions. RSI is 46.61. RSI measures the balance of upward and downward momentum, with readings near 50 signaling a relatively even contest; the current reading is below its historical average of 50.39 and slightly below normal. Intraday repair would align with the medium-term structure only if RSI recovers above 50 while the short-term moving-average spread turns positive.
IV. Price-Volume Structure and Price Range: Local Buying Improvement Remains Constrained by Aggregate Volume
The relative volume measure is 1.08 versus a historical average of 1.03, with only about 17 of 180 comparable periods higher, showing an increase in recent local trading activity. The cumulative slope of aggressive buying minus aggressive selling is +36 BTC versus a historical average of -22 BTC, also indicating a modest advantage for buyers. Yet total 24-hour volume remains below its historical average, so local activity has not broadened into market-wide expansion. For now, 75,588.00 USDT is the lower boundary and 78,057.60 USDT the upper boundary. The key question is whether the buyer advantage persists near the ceiling rather than merely rotating inside the range.
V. Derivatives Dislocations: Financing Cost and Volatility Pricing Are Rising Together
The average funding rate over the past 24 hours is +0.010000%, compared with a historical average of just +0.002055%; none of the 180 comparable periods was higher. Funding is the recurring payment exchanged between long and short participants in perpetual futures. A rare high means bullish exposure is expensive, raising reversal risk if price fails to follow. The gap between implied and realized volatility is +10.16 versus a historical average of -0.70, with only about 4 comparable periods higher. This measure compares option-implied future volatility with volatility already realized, and the current gap shows that the market is paying a clear premium for future movement. Open interest also fell 0.51%, so the setup looks more like rising risk pricing than broad new trend participation. Watch whether funding cools while price remains in the upper half of the range.
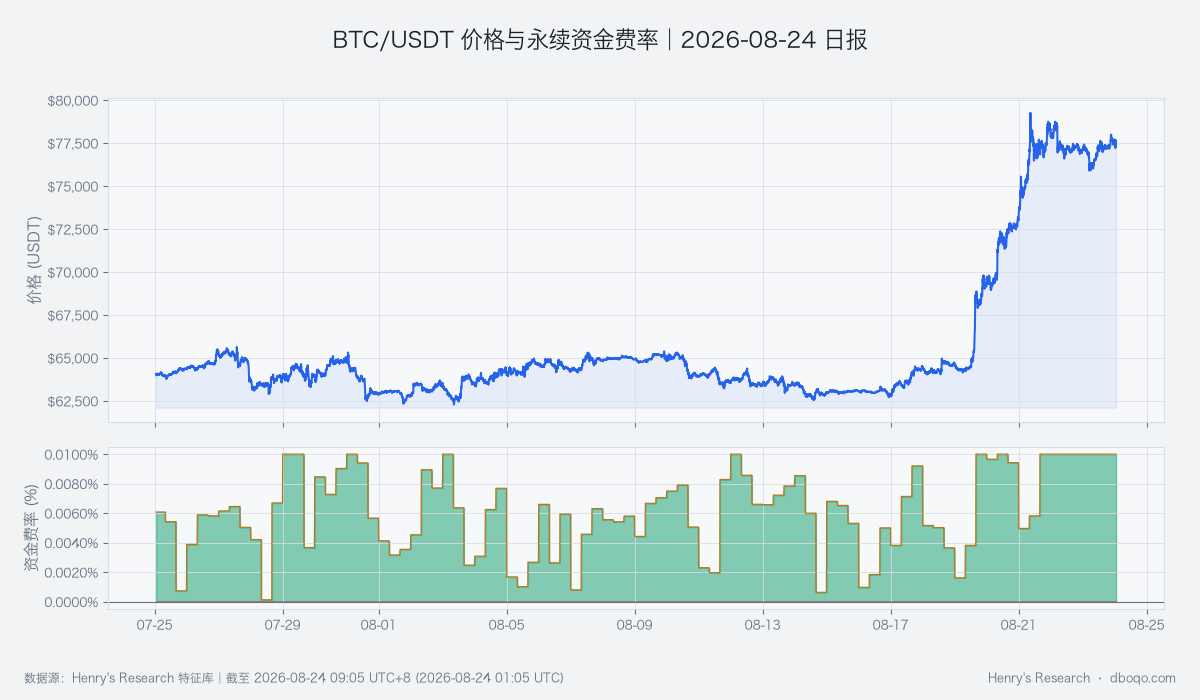
BTC/USDT 30-day price and perpetual funding rate, used to check whether derivatives heat is confirmed by continued price strength.
VI. Cross-Market and Capital Flows: Capital Is Warm, but the Macro Mapping Has Weakened
The BTC cross-market capital temperature is warm. 5-day ETF flows show net inflows of US$20.46 hundred million versus historical average net outflows of US$0.34 hundred million; only about 6 of 180 comparable periods were higher. 7-day stablecoin supply growth is +0.74%, also higher than about 89% of comparable periods, suggesting an improvement in short-term available liquidity. However, 30-day stablecoin supply growth remains -0.12%, so a longer-term improvement is not yet confirmed. The 30-day BTC-equity correlation is -0.153 versus a historical average of +0.137, with only about 1 comparable period equally low or lower. This means BTC has recently mapped poorly to equity direction, so moves in the dollar and volatility can only be treated as conditional factors. The next question is whether ETF inflows persist and receive confirmation from spot volume.
VII. Composite Signal and Scenario Tests: Bullish Clues Still Conflict with Price-Volume Evidence
The composite signal is bullish, consistent with ETF inflows, short-term stablecoin expansion, and improved aggressive buying. It is not fully consistent with weak intraday moving averages, total volume below its historical average, and elevated financing costs, so the final view remains range-bound. The bullish scenario requires price to hold above 78,057.60 USDT on stronger volume while funding cools, showing that spot demand rather than expensive derivatives demand is driving the move. The bearish scenario would be confirmed by a loss of 75,588.00 USDT together with aggressive buying minus aggressive selling turning negative. A price breach without matching price-volume evidence would not be enough to overturn the current view.
VIII. Risk Notice
The futures basis, funding rate, and option volatility pricing are all in unusual territory and may amplify short-term reversals. The sharp weakening of BTC-equity linkage also reduces the explanatory value of traditional cross-market comparisons. ETF and stablecoin measures update at different intervals; they describe the funding environment but cannot explain a single price move. The daily quantity proxy for the covered BTC perpetual markets does not represent the entire market. Continue to verify whether range boundaries, volume, and financing costs move together.
Disclaimer: This report was prepared by dboqo using market data through 2026-08-24 09:05 UTC+8. Cryptocurrency markets are highly volatile. This report is an objective analysis of market conditions only and does not constitute investment advice. Investors must assess risks independently and make prudent decisions.