I. Core Finding and Direction This Week: An Extreme Weekly Gain Confirmed by Price, Volume, and Capital
Data scope:This report covers the previous complete calendar week from 2026-8-17 08:00 to 8-24-08 00 (UTC+8), with data through 8-24 07:55. It includes 2,016 5-minute records and applies the same methodology to 104 complete comparable weeks. This allows weekly gains, volume, and capital metrics to be compared across periods; next week will continue to be assessed on the same calendar-week basis.
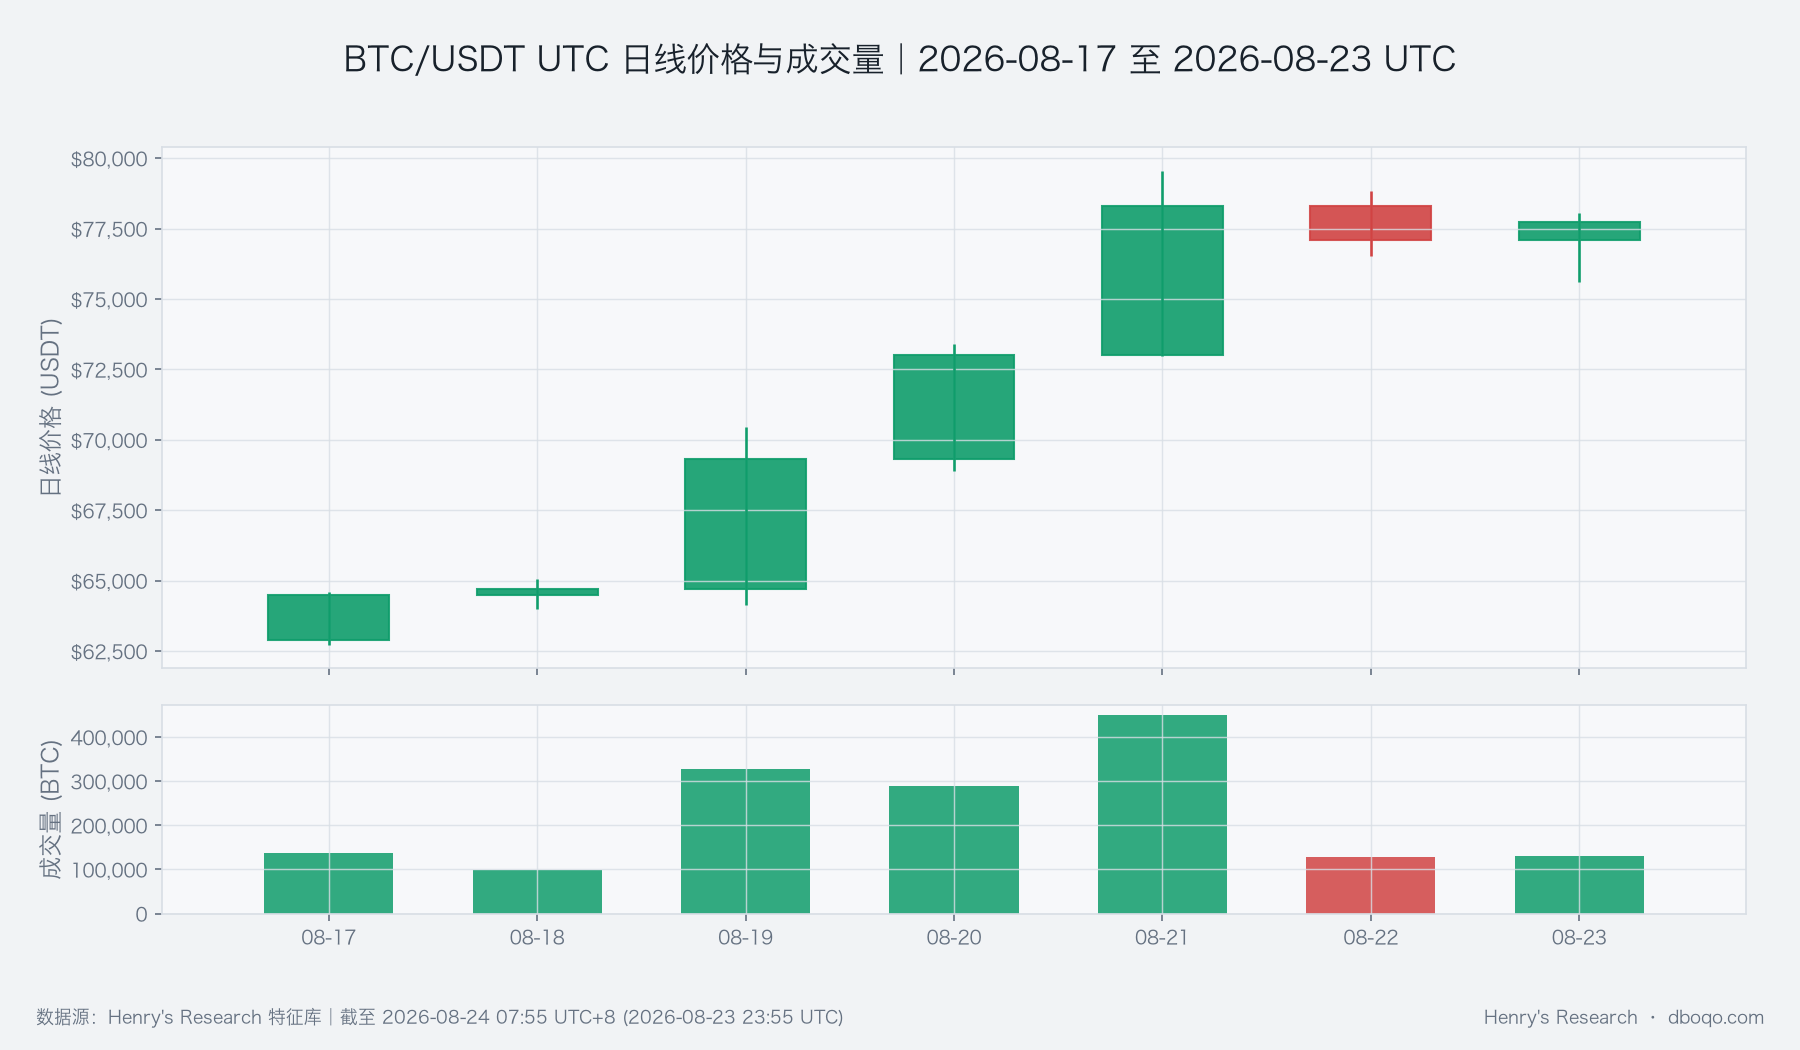
Core finding:BTC rose 23.56% this week, from 62,876.00 USDT to 77,719.10 USDT, with no higher observation among 104 comparable weeks. This was not an ordinary rebound, but a rare repricing. More importantly, volume and aggressive buying strengthened together, while ETF capital also showed notable inflows, indicating that the advance is supported by multiple forms of evidence. However, declining open-interest scale and longer-term liquidity contraction indicate that momentum behind chasing the move is not without discontinuities.
Historical comparison:This week's gain of 23.56% was far above the historical mean of 0.26%, with about 0 weeks higher among 104 comparable weeks. Volume of 1,562,002 BTC was also above the historical mean of 1,264,923 BTC and exceeded about 75% of comparable weeks. Strength in both price and volume makes the bullish baseline more credible than a price breakout alone; next week, the focus should be whether elevated volume can persist at high levels, rather than the closing level alone.
Methodology review:No candidates for unit, frequency, or magnitude anomalies were identified, and all candidate indicators may be used in the directional assessment. Although the price gain is an extreme market move, it is corroborated by volume, aggressive trading, and capital changes, and is therefore not treated as a methodological error. If subsequently measured indicators lose this cross-confirmation, confidence in the assessment should decline accordingly.
Directional assessment:Bullish bias. The rare gain, above-normal volume, strong aggressive buying, and warm capital conditions point in the same direction, but derivatives and longer-term capital evidence limit confidence; a sharp one-week rise is not extrapolated into an unconditional one-way market.
Assessment horizon:The next calendar week.Conditions for validity:Price holds near the weekend low of 75,588.00 USDT and retests the intraweek high of 79,555.50 USDT without a material contraction in volume.Invalidation conditions:Price falls below the breakout area near 72,992.40 USDT while aggressive buying weakens, ETF inflows cool, or derivatives pressure continues to expand; this would indicate that this week's repricing is beginning to turn into a pullback from elevated levels.
II. Historical Comparison and Key Deviations: Price Strength Far Exceeds Normal Conditions, with Volume Providing the First Layer of Validation
The factor most capable of changing the assessment is the price gain rather than the number of indicators: the weekly gain of 23.56% is far above the historical mean of 0.26%, with about 0 weeks higher among 104 comparable weeks, indicating that current momentum is in a rare range. This matters because an extreme advance may either establish a new price platform or exhaust buying power in the short term. The distinction depends on whether next week's pullback can hold the breakout area and whether volume can remain above historical norms.
Volume of 1,562,002 BTC was about 23% above the historical mean of 1,264,923 BTC and exceeded about 75% of comparable weeks, showing that market participation kept pace with the price move. This confirms the advance, but it has not reached a volume extreme seen in only a very small number of weeks; higher volume alone should therefore not be taken as a guarantee of another rapid rise. If price consolidates at elevated levels next week while volume eases moderately, that would be healthy digestion; if price declines alongside expanding volume, it would be closer to accelerating profit-taking.
III. Price Behavior and Trend: Momentum Is Relatively Strong, but High-Level Consolidation Will Test Demand
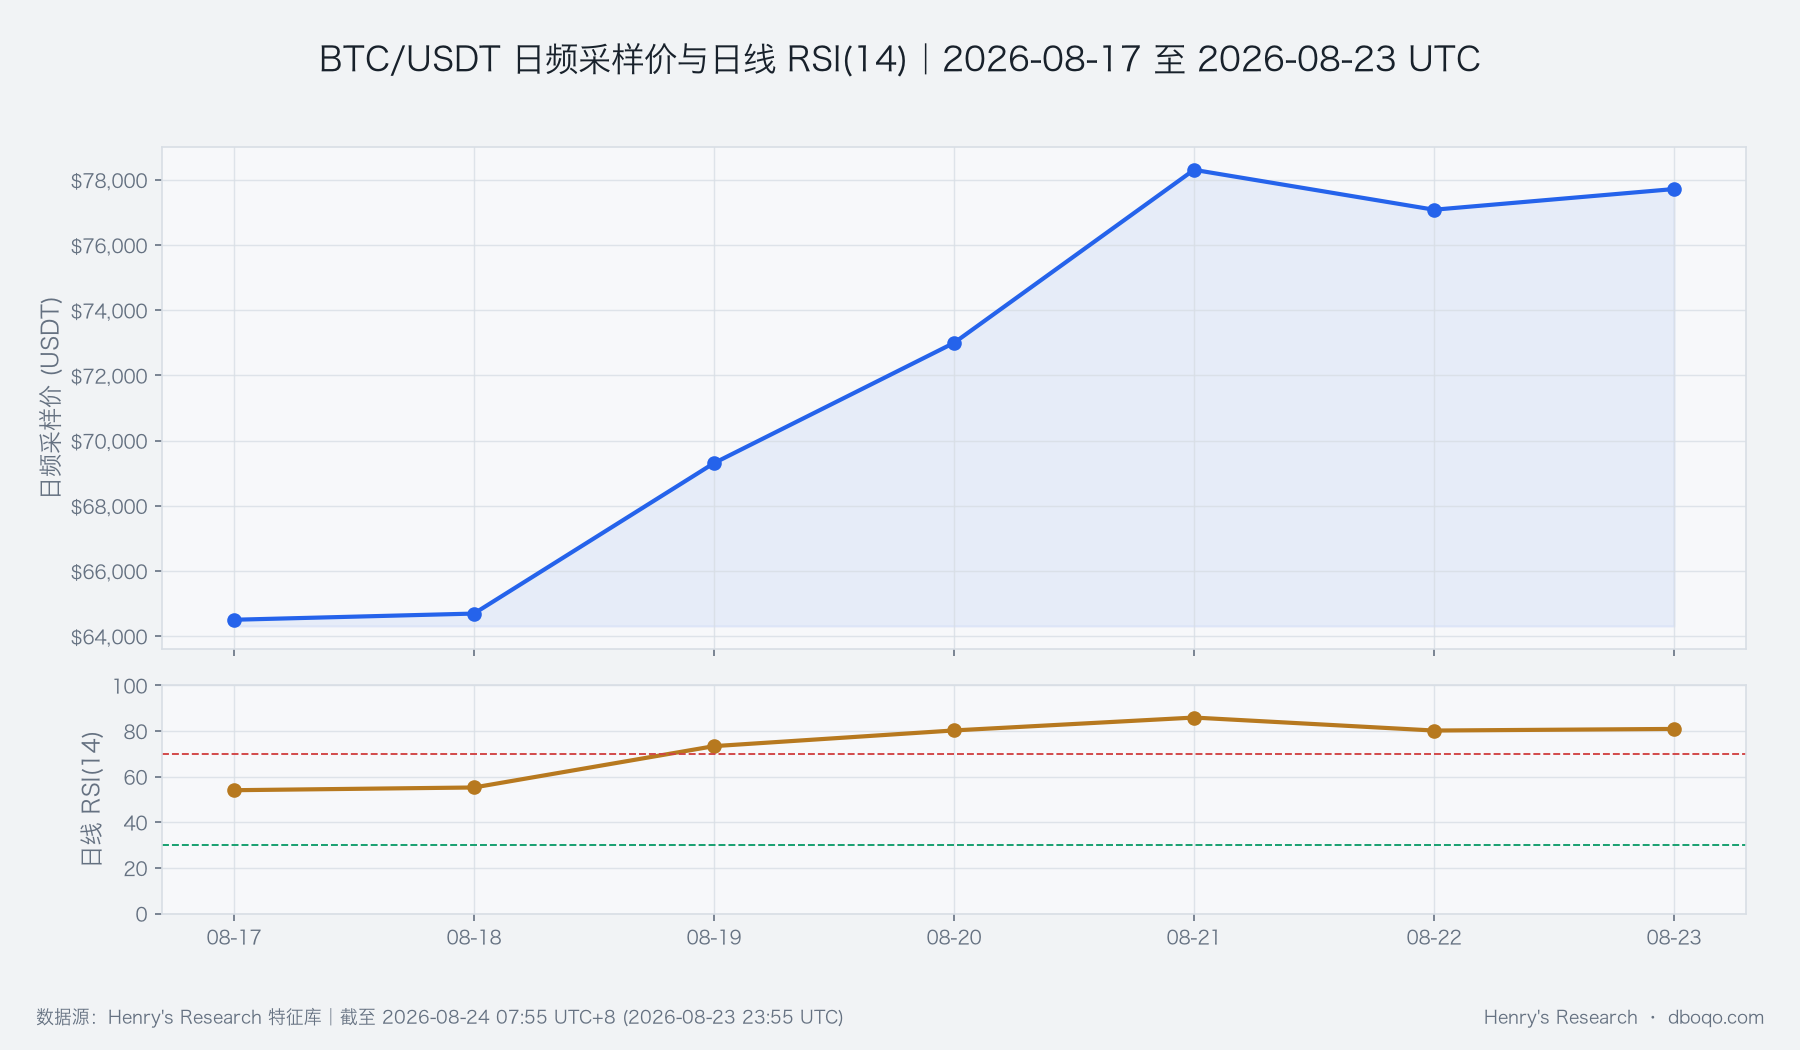
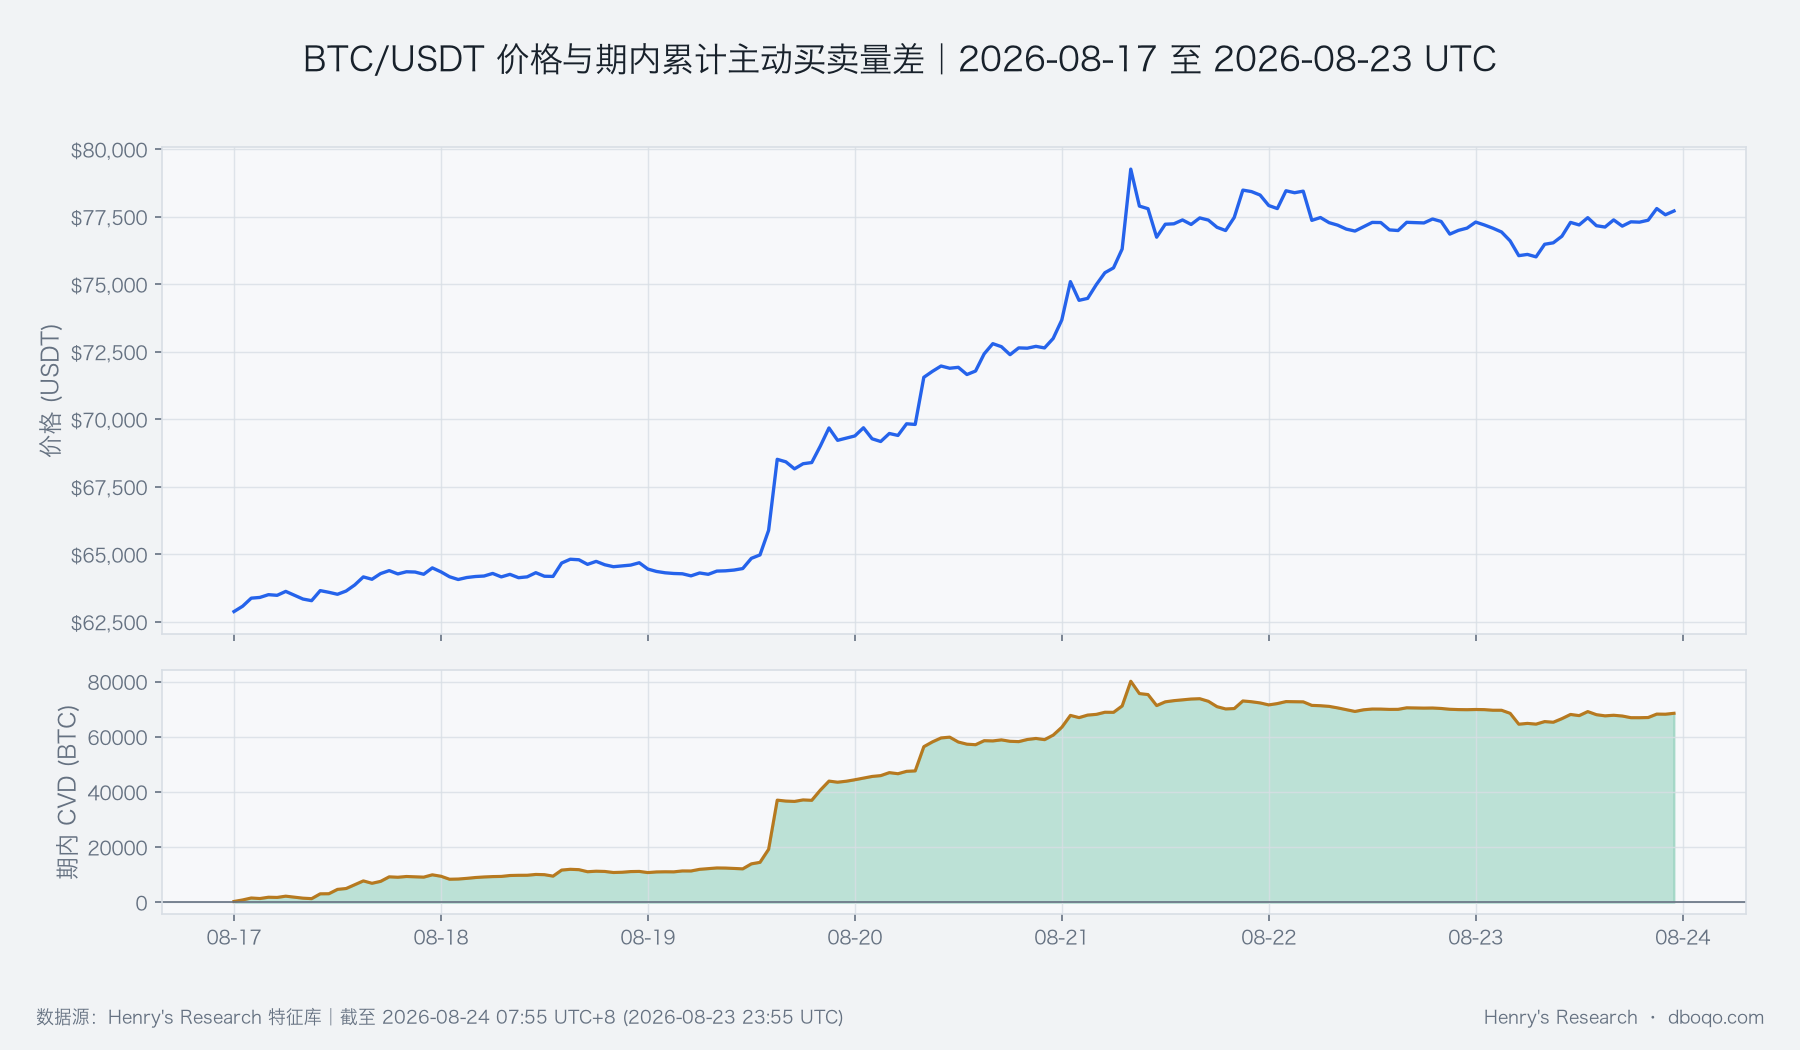
During the week, price gradually advanced from the low of 62,723.90 USDT to the high of 79,555.50 USDT and ultimately closed at 77,719.10 USDT, still near the upper end of the range, indicating that the main gain was not fully surrendered by the weekend. RSI, or the relative strength index, measures upside and downside momentum. Its ending value of 57.08 was above the historical mean of 51.16 and higher than about 63% of comparable weeks, indicating relatively strong but not rare conditions. This means the trend retains inertia while leaving room for turnover at elevated levels. Next week, watch whether RSI remains strong during price consolidation; if price makes new highs while momentum continues to weaken, the sustainability of the move will be questioned.
IV. Volume-Price Structure and Price Range: Aggressive Buying Confirms the Breakout, and Key Areas Become Defensive Lines
Aggressive net-buying intensity was +1.54, versus a historical mean of only +0.13. About 7 weeks were higher among 104 comparable weeks, showing that market-order aggressive buying made a meaningful contribution to this week's breakout. This indicator is important because it directly observes the force of aggressive buying less aggressive selling, rather than total volume alone; when it rises with price, it is generally more reliable than a low-volume advance. If price holds above 75,588.00 USDT next week and aggressive net buying remains positive, the bullish assessment remains valid; if price moves sideways while aggressive selling continues to dominate, weakening demand should be watched.
The range from 62,723.90 to 79,555.50 USDT formed the main price range this week, with the close in its upper portion, indicating continued demand at elevated levels. 79,555.50 USDT is the upside confirmation level, 75,588.00 USDT is the first weekend observation level, and the area near 72,992.40 USDT is an important defensive zone following the accelerated breakout. Consolidation between the first two levels does not impair the trend; a break below the latter level accompanied by expanding selling pressure would materially overturn the bullish structure.
V. Derivatives Deviations: Cooling Contract Scale and High Volatility Pricing Limit Room to Chase the Move
Derivatives evidence did not fully follow spot-market strength. The average change in open-interest scale during the week was -0.73%, versus a historical mean of +0.09%, lower than about 89% of comparable weeks, indicating that contract scale contracted during the advance. This may reduce the risk of cascading forced liquidations, but also means that new derivatives capital did not confirm the gain in parallel. Average funding was +0.007584%, above the historical mean of +0.004512% and higher than about 85% of comparable weeks, showing that the cost of holding long positions has already warmed. If price rises next week while open-interest scale recovers and funding does not overheat, the trend is more stable; if funding continues to rise while contract scale diverges from price, the risk of chasing the move increases.
The difference between implied and realized volatility was +10.38, versus a historical mean of +2.59, higher than about 88% of comparable weeks. Implied volatility reflects option-market pricing of future volatility; a relatively high spread means the market is paying a higher premium for large subsequent moves, rather than committing to an upside direction. Its importance is as a reminder that, even with a bullish bias next week, the path may be volatile. Whether this spread declines as price stabilizes can indicate whether the risk premium is being absorbed or continuing to accumulate.
VI. Cross-Market and Capital Conditions: Capital Temperature Is Warm, but Liquidity Is Diverging Across Short and Long Horizons
BTC cross-market capital temperature is warm (+0.36), consistent with price and aggressive-buying direction. ETF net inflows over the past 5 days were 19.28 hundred million USD, versus a historical mean net inflow of 3.33 hundred million USD, higher than about 87% of comparable weeks, indicating that recent allocation capital has provided important support. Meanwhile, stablecoin supply growth over 7 days was 0.68%, above the historical mean of 0.51%, showing a slight improvement in short-horizon liquidity. If ETFs maintain net inflows next week and short-horizon stablecoin growth does not turn negative, capital conditions may continue to support another attempt higher after high-level consolidation.
The countervailing evidence is that stablecoin supply declined by 0.65% over 30 days, whereas the historical mean was growth of 2.36%, lower than about 83% of comparable weeks, indicating that longer-horizon on-market liquidity has not expanded comprehensively. BTC's 30-day correlation with U.S. equities was -0.152, versus a historical mean of +0.174; about 4 weeks were equally low or lower among 104 comparable weeks, indicating that BTC's performance this week relied less on moves in the same direction as U.S. equities. ETF, stablecoin, dollar, and volatility data have daily-frequency or rolling-window lags. Capital temperature can indicate only a conditional environment and should not be counted repeatedly or interpreted as certain causation; next week should assess whether these divergences converge.
VII. Composite Signals and Next-Week Scenarios: The Bullish Consensus Holds, with a Clear Invalidation Line
The composite signal is bullish, consistent with the price gain of 23.56%, above-normal volume, strong aggressive buying, and warm capital conditions. The main counterarguments are contracting open-interest scale, a relatively high volatility premium, and the decline in stablecoin supply over 30 days. The baseline scenario is that price digests gains between 75,588.00 and 79,555.50 USDT before trying to break higher again. Volume need not replicate this week's peak, but aggressive buying and ETF inflows must not weaken at the same time. If price establishes itself above 79,555.50 USDT and capital evidence remains positive, the bullish assessment is reinforced.
The alternative scenario is that price falls below 75,588.00 USDT and tests 72,992.40 USDT. As long as the latter holds and selling pressure does not expand, this may still be regarded as a normal pullback after a rapid rise. The combination that would genuinely overturn the assessment is a break below 72,992.40 USDT, aggressive selling dominance, a clear cooling of ETF inflows, and a continued rise in derivatives risk premium. In that case, the view should be reduced from bullish to range-bound or bearish, rather than using this week's extreme gain to explain subsequent price action.
VIII. Risk Notice
An extreme weekly gain amplifies both chase-the-move and pullback risks; rare historical strength does not guarantee continued gains in the following week. Cross-market capital indicators update at different frequencies, and derivatives pricing may move ahead of spot changes. Price gaps, declining liquidity, or abrupt changes in macro risk appetite may rapidly invalidate the conditions above. Readers should prioritize whether key price areas, aggressive trading, capital flows, and derivatives pressure change together.
Disclaimer:This report is prepared by dboqo based on market data through 2026-08-24 07:55 UTC+8. Cryptocurrency markets are highly volatile. This report is solely an objective analysis of market developments anddoes not constitute any investment advice, and investors must independently assess risks and make prudent decisions.