I. Core Finding and Direction: Momentum Is Exceptionally Strong, but Basis Remains Negative
Data context: As of 2026-08-25 09:05 UTC+8, the current observation covers the latest 24 hours and is compared with 180 historical 24-hour windows aligned to the same cutoff. Means, relative positions, and directional readings use consistent frequencies and units.
Core finding: The combination of rising prices and heavier trading volume has pushed short-term momentum into an exceptionally strong zone, but futures still trade at a discount to spot. This means the rally has genuine price-and-volume support while derivatives have yet to offer unqualified confirmation. The move currently looks more like a strong advance that still needs validation than a one-way market in which pullback risk can be ignored.
Historical comparison: The MACD histogram stands at +108.94 USDT versus a historical mean of just +1.15 USDT; none of the 180 comparable periods was higher, indicating that the pace and persistence of the advance are far above normal. At the same time, basis is -0.03% versus a historical mean of -0.05%, with only about 3 comparable periods higher. The discount has narrowed materially but has not turned positive, which is the central tension for judging whether the move can continue.
Measurement review: All 13 quality checks passed. No anomaly was found in units, frequency, or scale, and there were no measurement-scope candidates that needed to be excluded from the directional assessment. These extreme historical positions are therefore treated as market moves rather than statistical errors.
Directional view: Bullish. Assessment horizon: The next 24 hours. Confirmation conditions: Price holds above the short-term moving average, trading volume does not fade materially, basis moves closer to zero, and aggressive buying continues to exceed aggressive selling. Invalidation conditions: Price falls back into the prior breakout range, volume contracts rapidly, or basis widens into a deeper discount. Any one of these developments would lower the view to range-bound.
II. Key Market Data: A Higher-Volume Advance Provides Initial Breakout Confirmation
BTC trades at 79,775.10 USDT, up +3.02% over the past 24 hours versus a historical mean of only +0.12%. Only about 13 of the 180 comparable periods recorded a larger gain, showing that this is not ordinary intraday noise. Trading volume reached 238,720 BTC versus a historical mean of 160,123 BTC, higher than about 87% of comparable periods. Price and volume rising together is more reliable than a price-only move. The next test is whether 79,974.80 USDT can be decisively cleared; repeated failures near that level would suggest that strong turnover is becoming distribution pressure.
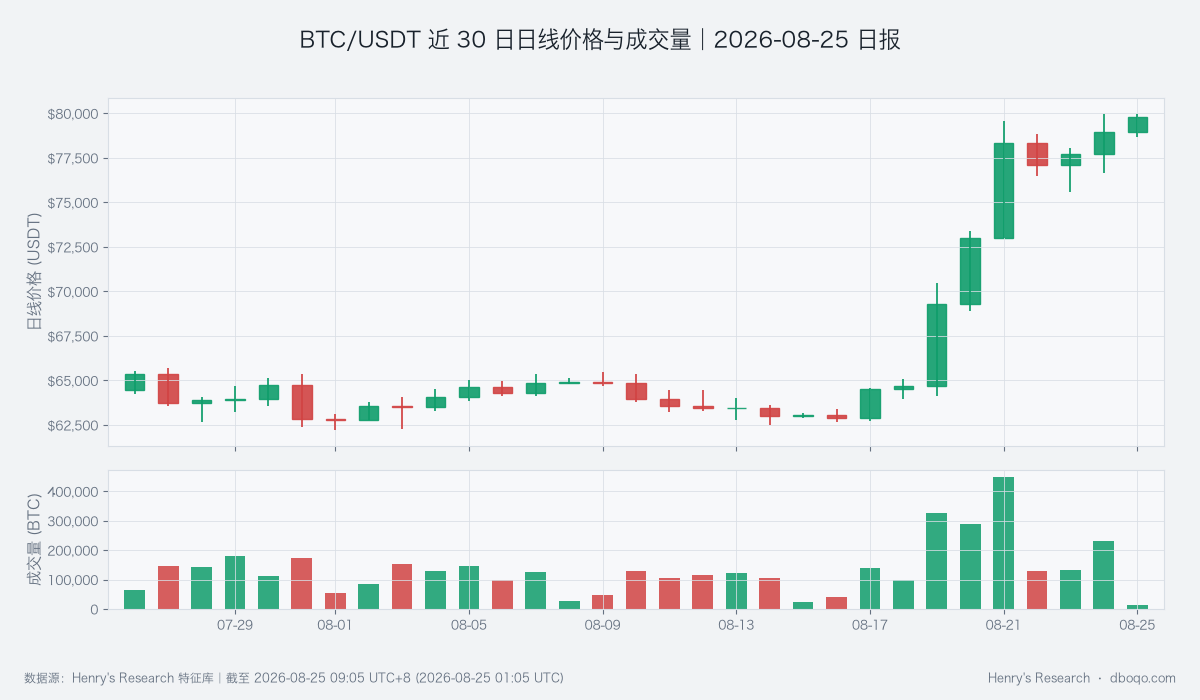
BTC/USDT Daily Price and Volume Over the Past 30 Days
III. Price Action and Trend: Momentum Leads Price, While Overheating Risk Rises
The MACD histogram tracks whether a trend is accelerating or decelerating. Its exceptionally high current reading shows that buying pressure has progressed from a rebound into trend acceleration. The short-term moving-average spread has widened to +339.17 USDT versus a historical mean of +5.31 USDT, with only about 3 comparable periods higher, further supporting the upward trend. However, the farther momentum moves beyond normal conditions, the greater the potential volatility from profit-taking. The key question is no longer whether momentum can print another extreme, but whether price can hold the short-term moving average on a pullback and recover quickly.
IV. Price-Volume Structure and Range: Aggressive Buying Improves, but the Upper Boundary Still Needs Turnover
The cumulative slope of aggressive buying minus aggressive selling is +56 BTC versus a historical mean of -23 BTC, higher than about 71% of comparable periods. This shows that buyers are participating in the advance, although their strength is not yet exceptionally rare. Price is already near the upper boundary of its recent range, making each increment of new turnover more important. If aggressive buying stays positive and pullbacks occur on lighter volume, that boundary could become support. If price reaches a new high while aggressive buying weakens, it would contradict the current bullish thesis.
V. Derivatives Anomaly: The Discount Has Narrowed but Not Reversed, Leaving Caution in Risk Pricing
Basis measures the premium or discount of futures relative to spot. The current -0.03% reading is materially narrower than the historical mean of -0.05%, but the negative value shows that futures capital has not fully followed the spot rally. At the same time, options markets are pricing future volatility well above recent realized volatility, indicating that investors are paying for larger moves in either direction. If basis turns positive while funding remains orderly, confidence in the rally would improve. If the discount widens again, even a further price advance should be treated as a fragile breakout.
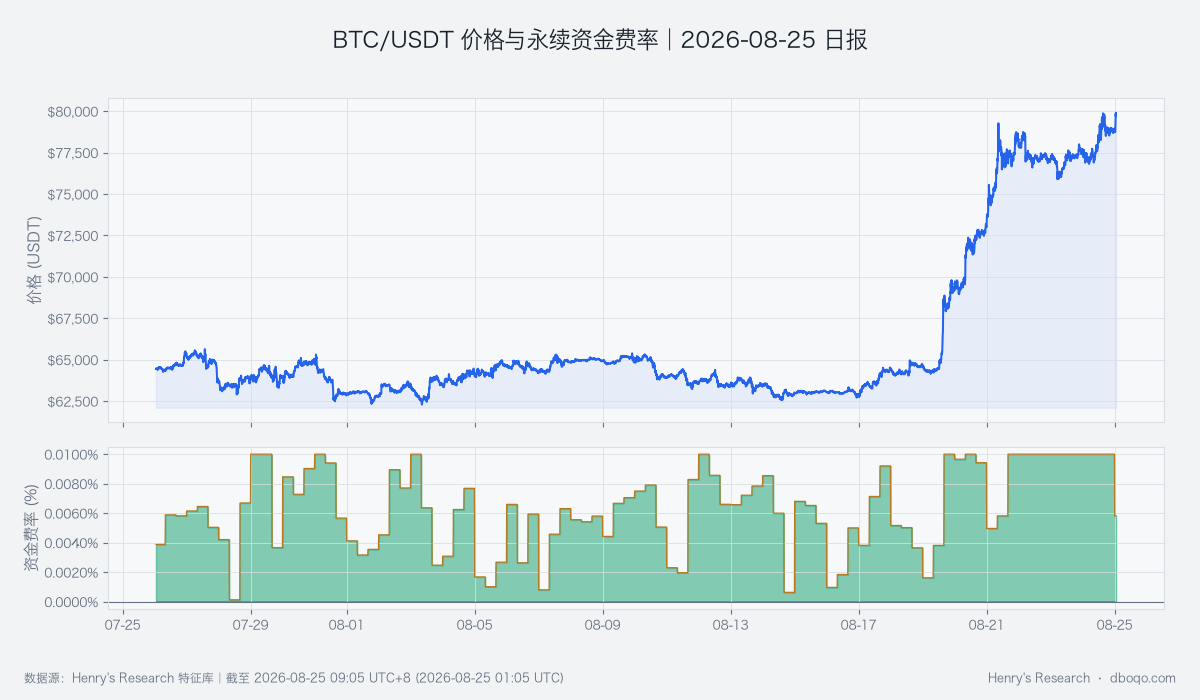
BTC/USDT Price and Perpetual Funding Rate Over the Past 30 Days
VI. Cross-Market and Capital Conditions: Capital Is Warm, but External Linkage Has Weakened Sharply
The BTC cross-market capital pulse is warm. ETF flows show a net inflow of 15.29 hundred-million US dollars over the past 5 days versus a historical mean net outflow of 0.24 hundred-million US dollars, with only about 13 of the 180 comparable periods higher. Stablecoin supply growth over 7 days is +0.75% versus a historical mean of -0.03%, higher than about 89% of comparable periods, indicating improving off-exchange and on-chain liquidity. A softer dollar backdrop and normal VIX conditions do not materially offset that support. However, BTC's correlation with U.S. equities has fallen to -0.162 versus a historical mean of +0.134, with almost no comparable period lower. This means the current move depends more heavily on crypto-specific capital; the warm pulse could cool quickly if ETF flows weaken or the dollar strengthens again.
VII. Integrated Signal and Scenario Validation: Bullish Consensus Holds, but Basis Confirmation Is Still Needed
The integrated signal is bullish and broadly consistent with rising prices, heavier volume, improving aggressive buying, and a warm capital pulse. Negative basis and weaker external linkage are the counterevidence. The base case is that price consolidates at elevated levels before extending higher. Confirmation would come from volume remaining above normal, pullbacks holding the short-term moving average, and basis converging toward zero. A high-volume decline, a turn to net aggressive selling, or a cooling capital pulse would overturn the current view and make a broad range more likely.
VIII. Risk Notice
Momentum and price are both far from normal conditions. Continued good news could accelerate the advance, but disappointment could also produce a faster pullback. The derivatives discount, richer options volatility, and weaker cross-asset linkage make any single indicator more prone to giving a false signal. Price, volume, aggressive buying, basis, and the capital pulse should therefore be monitored for alignment rather than treating one strong window as a certain trend.
Disclaimer: This report was prepared by dboqo using market data available as of 2026-08-25 09:05 UTC+8. Cryptocurrency markets are highly volatile. This report is an objective analysis of market conditions only and does not constitute investment advice. Investors must assess risks independently and make prudent decisions.