Core Finding and Direction: A Rare Negative Equity Link Meets Improving Liquidity
Data context: As of 2026-08-26 09:05 UTC+8, this report reviews the latest 24 hours and compares them with 180 historical 24-hour windows aligned to the same cutoff; differences in frequency and units have been checked on a consistent basis. Core finding: BTC’s usual positive relationship with U.S. equities has turned unusually negative. Price fell -1.25% over the latest 24 hours, yet trading activity, trend momentum, and the capital backdrop did not weaken in tandem. The market therefore looks more like an independent consolidation after a strong advance than a broad risk-asset retreat. Historical comparison: BTC’s correlation with U.S. equities is -0.166 versus a historical average of +0.132; among 180 comparable periods, only about 1 was as low or lower. This means conventional risk appetite currently explains less of BTC’s movement, making its own price-volume and liquidity evidence more important. Scope review: All 13 quality checks passed, with no unit, frequency, or magnitude issues and no scope-anomaly candidates excluded from the directional assessment. Directional view: Bullish, but as a conditional repair after the pullback; improving liquidity does not guarantee that price will rise. Horizon: The next 24 hours. Confirmation conditions: Price holds near the 24-hour low of 77,808.10 USDT, active buying remains positive, and BTC challenges 81,270.50 USDT again. Invalidation conditions: Price breaks below 77,808.10 USDT on expanding volume, or funding remains elevated while active buying turns negative.
Key Market Data: A High-Volume Pullback Has Not Yet Broken the Trend Base
BTC is at 78,781.00 USDT, down -1.25% over 24 hours, within a range of 77,808.10 to 81,270.50 USDT. Volume reached 233,056 BTC versus a historical average of 159,754 BTC, higher than about 86% of comparable periods. Falling price alongside active turnover shows that high-level disagreement is real, so the decline should not be dismissed as a thin-market fluctuation. Even so, the added selling activity has not pushed price below the medium-term trend base. The key next test is whether buyers continue to absorb supply near 77,808.10 USDT in a high-volume environment; if that support disappears, the bullish view would weaken quickly.
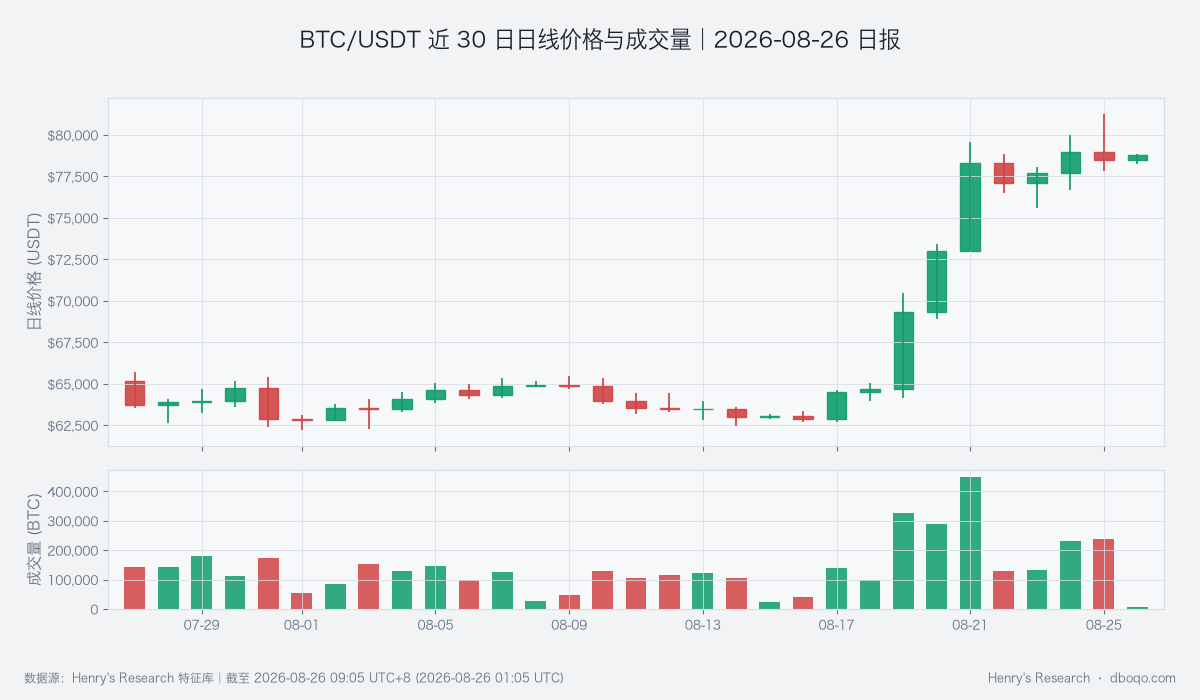
BTC/USDT daily price and volume over the past 30 days
Price Action and Trend: The Pullback Has Not Negated Stronger Momentum
The MACD histogram measures whether trend momentum is accelerating or slowing. It stands at +39.10 USDT, well above its historical average of +1.38 USDT; only about 9 of 180 comparable periods were higher. Meanwhile, short-horizon RSI is 57.91 versus a historical average of 50.37, without entering an extremely crowded zone. Together, these readings indicate that trend inertia still points upward and that the -1.25% decline is closer to momentum digestion. Strong momentum will translate back into price progress only if BTC reclaims its short-term balance area and approaches 81,270.50 USDT.
Price-Volume Structure and Range: Active Buying Has Improved, but High-Level Absorption Needs Confirmation
The cumulative slope of active buying minus active selling is +35 BTC versus a historical average of -20 BTC, higher than about 62% of comparable periods. Active net-buying strength is also higher than about 78% of comparable periods. This shows that buyers are still crossing the spread during the pullback, directly supporting the repair scenario. Price remains relatively high within its recent range, where a move toward 81,270.50 USDT may meet profit-taking. If active buying fades into that test, even sustained total volume would be more consistent with range trading than a clean breakout.
Derivatives: Elevated Funding Costs Limit the Upside Slope
The funding rate is the periodic payment exchanged between long and short positions in perpetual contracts and helps indicate crowded momentum chasing. Its 24-hour average is +0.008699%, above the historical average of +0.002156%; only about 7 of 180 comparable periods were higher. The spot-futures basis measures the premium of futures over spot; at -0.04%, it remains negative, showing that spot and derivatives do not yet share a uniformly optimistic valuation. Together, these conditions mean that near-term bullish exposure is costly while forward conviction remains incomplete. The bullish view therefore depends more on spot absorption than on continued contract-driven buying.
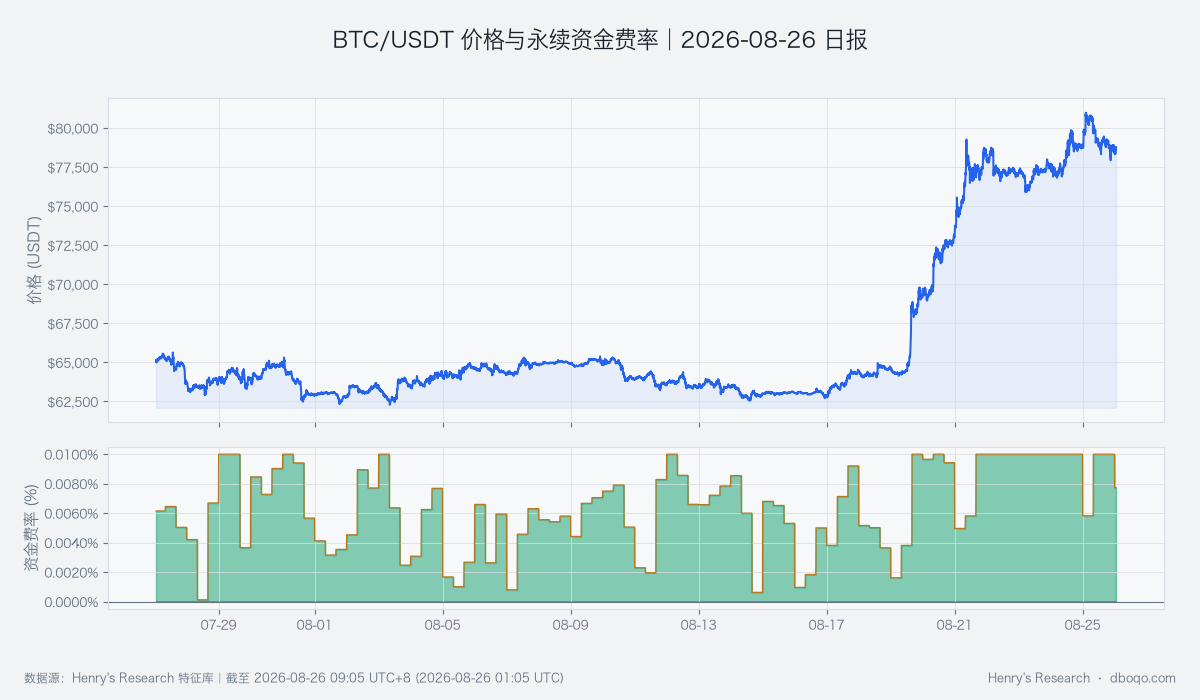
BTC/USDT price and perpetual funding rate over the past 30 days
Cross-Market and Capital Conditions: Liquidity Is Warm, but Macro Decoupling Raises Uncertainty
The BTC cross-market capital temperature is warm. ETFs recorded a 5-day net inflow of 12.60 hundred million U.S. dollars versus a historical average net outflow of 0.18 hundred million U.S. dollars; only about 16 of 180 comparable periods were higher. Stablecoin supply grew +0.79% over 7 days versus a historical average of -0.02%, again with only about 16 comparable periods higher. A relatively softer dollar and a VIX in its normal range also favor risk demand. However, BTC’s correlation with U.S. equities has fallen to -0.166, showing that macro transmission is unstable. Better liquidity only raises the likelihood of support and still requires confirmation from price and active buying.
Composite Signal and Scenario Tests: The Bullish View Broadly Matches Liquidity and Active Buying
The composite signal is bullish and broadly consistent with MACD momentum, active buying, and warm capital conditions, but it conflicts with the 24-hour price decline, elevated funding, and negative basis. The base case is consolidation above 77,808.10 USDT followed by another test of 81,270.50 USDT; a breakout accompanied by persistently positive active buying would strengthen the view. The adverse case is a high-volume break below 77,808.10 USDT, or elevated funding alongside continued price weakness. Either outcome would overturn the repair thesis and shift the assessment toward range-bound or bearish.
Risk Notice
The principal risk is not one unreliable indicator, but the coexistence of improving liquidity, upward trend inertia, and a near-term price decline. The unusually negative equity link also means that traditional cross-market relationships may normalize quickly or decouple further; either change could amplify intraday volatility. This assessment covers the next 24 hours and does not apply to a longer horizon. The key boundaries remain 77,808.10 and 81,270.50 USDT.
Disclaimer: This report was prepared by dboqo using market data available as of 2026-08-26 09:05 UTC+8. Cryptocurrency markets are highly volatile. This report is an objective analysis of market conditions only and does not constitute investment advice. Investors must assess risks independently and make prudent decisions.