I. Core Finding and Direction: Improving Flows Have Yet to Reverse Short-Term Weakness
Data scope: Data are current through 2026-08-27 09:05 UTC+8. The current observation window covers the latest 24 hours and is compared with 180 historical 24-hour windows aligned to the same cutoff time. Every historical position uses consistent units, frequencies, and magnitude conventions.
Core finding: BTC’s normally positive relationship with U.S. equities has turned distinctly negative, while ETF inflows, better stablecoin supply, and a softer dollar have jointly warmed the capital backdrop. The problem is that this external support has not yet lifted short-term trend momentum and trading scale together, leaving the composite signal bearish. The central tension is not whether capital conditions have improved, but whether that improvement can feed through to price momentum and sustained buying.
Historical comparison: BTC’s correlation with U.S. equities is -0.168 versus a historical average of +0.129; among 180 comparable periods, only about 1 was as low or lower. This indicates an unusually sharp cross-market pricing divergence. It matters because the direction of U.S. equities is temporarily less useful for explaining BTC, and the next test is whether the decoupling closes quickly or BTC-specific selling pressure remains dominant.
Scope check: No anomaly was found in units, sampling frequency, or magnitude, and there are no scope-anomaly candidates that must be excluded from the directional assessment. The negative equity link is therefore treated as a market anomaly, although correlation alone does not establish a directional cause.
Directional view: Bearish. Capital conditions provide a buffer, but they are not yet aligned with short-term momentum, trading volume, and derivatives capital in a common bullish signal.
Horizon: The next 24 hours. Conditions for the view to hold: Price remains capped near 79,200.00 USDT, short-term momentum stays weak, and volume does not recover clearly above its historical average. Invalidation: Price breaks decisively above 79,200.00 USDT on stronger volume, while net aggressive buying continues to expand and short-term momentum turns positive.
II. Key Market Data: A Narrow Pullback Lacks Volume Confirmation
BTC last traded at 78,691.00 USDT, down 0.10% over the latest 24 hours, within a 77,600.00–79,200.00 USDT range. The price change is close to the historical middle, so the market has not produced a one-way shock. Yet volume of 131,852 BTC is below its 160,084 BTC historical average and lower than roughly 61% of comparable periods, meaning the pullback is mild but underlying demand is also insufficient. The next question is whether the range high can be broken as volume expands; otherwise, the narrow consolidation is more likely to remain a weak digestion phase.
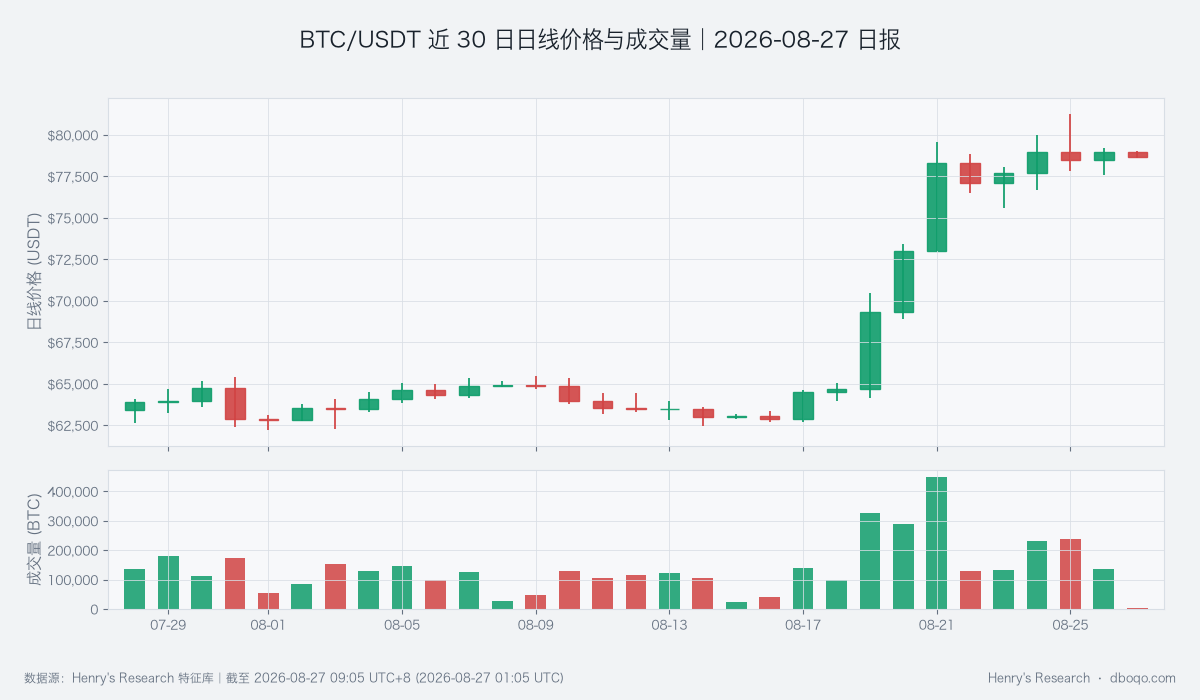
BTC/USDT daily price and volume over the past 30 days
III. Price Action and Trend: Long-Term Support Holds as Short-Term Momentum Weakens
Price remains above the 10-day average at 74,106.73 USDT and the 30-day average at 67,247.93 USDT, so the medium-term structure has not broken. However, the short-term MACD histogram is -30.59 USDT versus a historical average of +1.78 USDT; among 180 comparable periods, only about 14 were as low or lower. MACD is used to track acceleration and deceleration in price momentum, and this gap shows that short-term drive has cooled materially. Intraday RSI is 44.81, also below its 50.54 historical average. RSI measures the balance of buying and selling momentum; this reading is not deeply oversold, so long-term support remains but there is no strong reversal evidence. The next test is whether short-term MACD can return toward zero and be confirmed by price reclaiming the range high.
IV. Price–Volume Structure and Range: Aggressive Buying Improves but Lacks Scale
The cumulative slope of aggressive buying minus aggressive selling is +11 BTC, better than its -20 BTC historical average but still within the normal historical range. This means active buying is providing some buffer, though not enough to reverse the trend by itself. Combined with below-normal volume, the current structure looks more like limited absorption than broad expansion ahead of a breakout. The latest 24-hour low is 77,600.00 USDT and the high is 79,200.00 USDT. If aggressive buying expands alongside rising volume, a break of the high would have better follow-through value. If buying fades and price breaks the low, the claim that improving flows support price would be refuted.
V. Derivatives Anomalies: Funding Costs Are Elevated as Participation Contracts
The average funding rate over the latest 24 hours is +0.006765%, above its +0.002202% historical average and higher than roughly 85% of comparable periods. Funding rates reflect the carrying cost exchanged between long and short positions in perpetual contracts. An elevated rate shows that bullish demand already carries a higher cost, increasing crowding risk if price fails to rise with it. Meanwhile, open-contract interest changed by -0.67%, versus a historical average of +0.21%, lower than roughly 67% of comparable periods and evidence of shrinking participation. Together, the readings imply that optimistic pricing remains but new participation is limited. The next test is whether funding cools toward normal while price holds, or participation expands again alongside stronger spot volume.
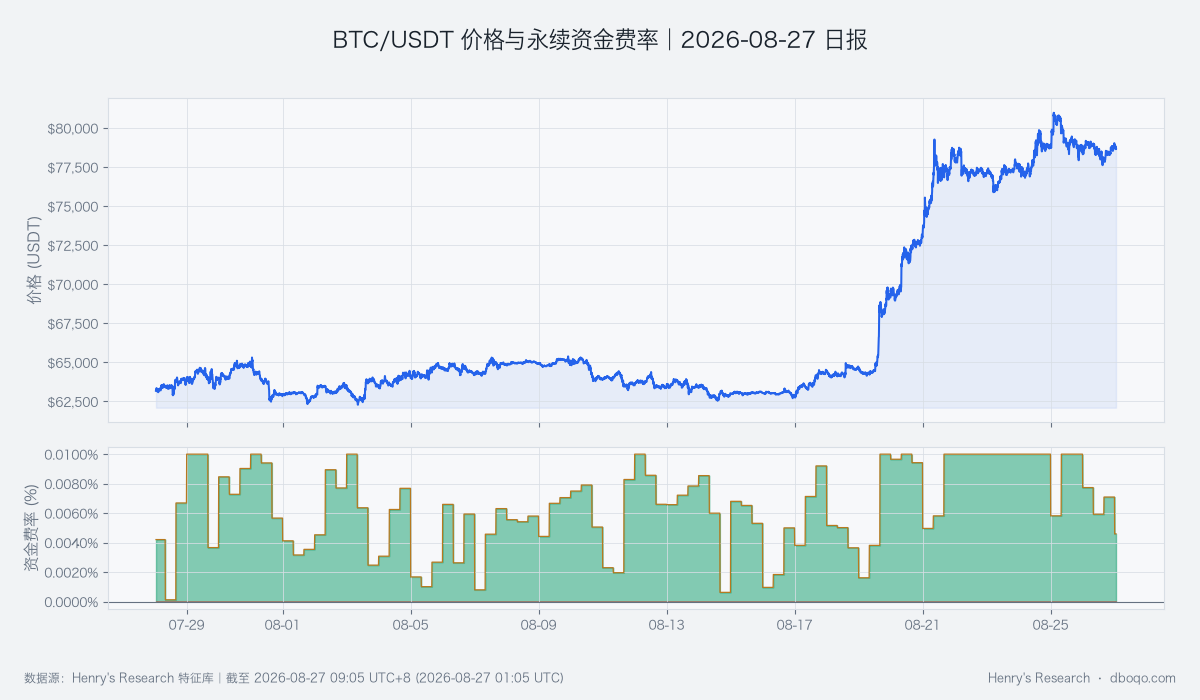
BTC/USDT price and perpetual funding rate over the past 30 days
VI. Cross-Market and Capital Conditions: A Warm Capital Backdrop Has Not Fully Transmitted
The BTC cross-market capital temperature is warm. Net ETF inflows over the past 5 days total 12.67 hundred-million U.S. dollars, versus a historical average net outflow of 0.14 hundred-million U.S. dollars; among 180 comparable periods, only about 17 were higher. Stablecoin supply grew +0.84% over 7 days, compared with a -0.02% historical average, with only about 13 periods higher. Together, these readings show a clear improvement in available capital. The dollar index is 98.91, and its deviation is lower than roughly 85% of comparable periods, which usually reduces an external headwind for risk assets. VIX is 15.68 and associated risk pressure remains normal, so it does not offset the improvement in capital conditions. However, the equity correlation has fallen to -0.168, showing that cross-market transmission is changing; improving flows cannot be treated as a guaranteed cause of higher prices. The next test is whether ETF and stablecoin improvement persists and ultimately appears in stronger BTC volume and trend repair.
VII. Composite Signal and Scenario Tests: The Bearish View Awaits Price–Volume Refutation
The composite signal is bearish, consistent with weaker short-term MACD, volume below its historical average, and contracting derivatives participation, but inconsistent with the warm cross-market capital backdrop. This divergence means capital support may limit downside, so the assessment is closer to weak consolidation with reversal conditions than to a certain decline. The bearish scenario requires resistance near 79,200.00 USDT to remain effective and aggressive buying to fail to expand volume. A volume-backed break above that level, positive MACD momentum, and either cooler funding or renewed derivatives participation would overturn the current view. Conversely, a break below 77,600.00 USDT alongside stronger aggressive selling would confirm that capital support has not yet translated into price support.
VIII. Risk Notice: Cross-Market Decoupling Increases Forecast Error
The main uncertainty is the rapid change in cross-market relationships. BTC’s negative correlation with U.S. equities may repair quickly or continue to reflect independent capital behavior. ETF and stablecoin indicators update at different speeds, while funding and open-contract interest can reverse rapidly during volatile periods; no single indicator should therefore be treated as a deterministic cause. Key items to monitor are the 77,600.00–79,200.00 USDT range, trading volume, aggressive buying and selling, and whether derivatives capital conditions provide consistent confirmation.
Disclaimer: This report was prepared by dboqo using market data through 2026-08-27 09:05 UTC+8. Cryptocurrency markets are highly volatile. This report is an objective analysis of market conditions only and does not constitute investment advice. Investors must assess risks independently and make prudent decisions.