Core Finding and Direction: Improving Liquidity Supports the Rally, but Elevated Price Deviation Still Needs Price-Volume Confirmation
Data context: Data are current through 2026-08-28 08:40 UTC+8. The current period covers the preceding 24 hours at the same cutoff and is compared with as many as 180 historical 24-hour samples aligned to that cutoff.
Core finding: BTC rose 1.96% over the past 24 hours, while 7-day stablecoin supply growth reached +0.69% and 5-day ETF flows recorded a net inflow of USD 11.92 in hundred-million units. This indicates that the liquidity backdrop continues to support price. However, price deviation climbed to +1.59 and equity correlation fell to -0.201, making the advance more dependent on crypto-specific demand than on broad risk-asset participation. The central tension is the coexistence of improving liquidity and elevated price deviation; further gains require continued confirmation from volume and aggressive buying.
Historical comparison: The historical mean price return is +0.12%, and the current gain is higher than about 86% of comparable periods. The historical mean for 7-day stablecoin supply growth is -0.02%, while the current reading is higher than about 84% of comparable periods. More strikingly, the historical mean correlation between BTC and equities is +0.126, whereas only about 1 of 180 comparable periods was as low as or lower than the current reading. This means the rally is relatively strong, but external confirmation has weakened sharply, so price appreciation alone is insufficient for the assessment.
Scope review: All 13 quality checks passed. No unit, frequency, or magnitude inconsistency was found, and there are no scope-anomaly candidates that must be excluded from the directional assessment. The unusually low equity correlation is therefore treated as a market move.
Directional view: The evidence points to a bullish bias, but it is conditional on price-volume confirmation. Horizon: The next 24 hours. Confirmation conditions: Price holds near 79,000 USDT and establishes a durable move above 80,845.10 USDT, while volume and aggressive buying improve. Invalidation conditions: Price falls below 78,522.10 USDT, or funding continues to rise while spot demand weakens.
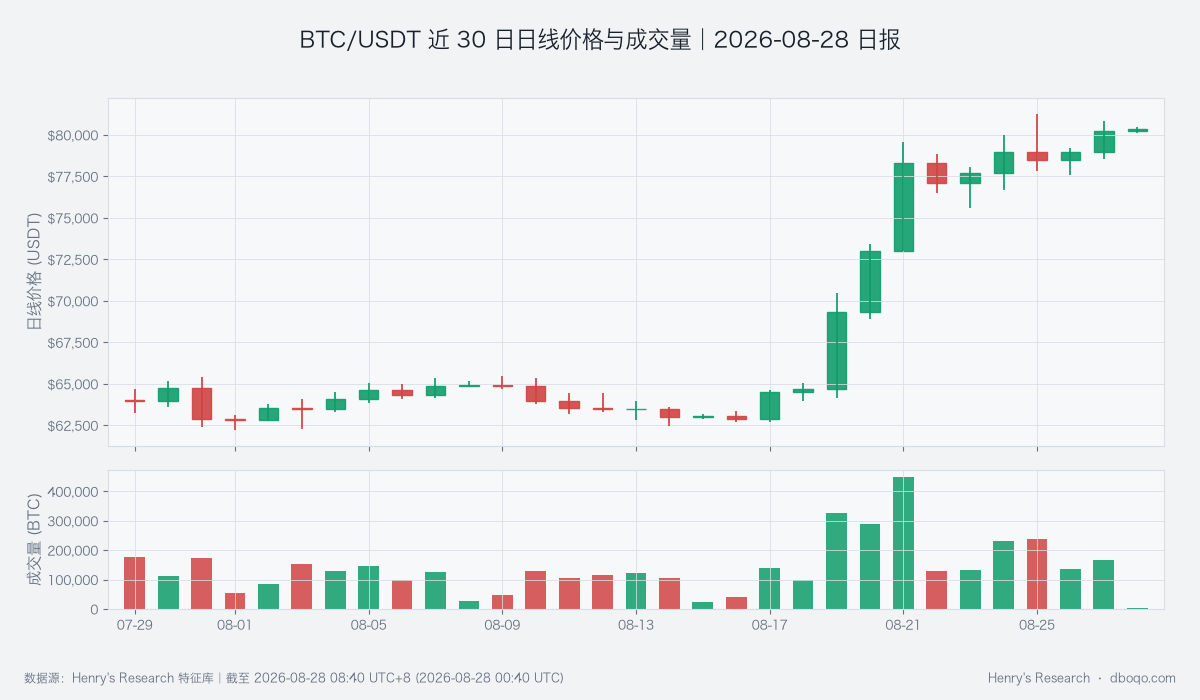
BTC/USDT daily price and volume over the past 30 days
Key Market Data: The Advance Is Near the Upper End of History, While Volume Is Not Overheated
BTC trades at 80,383.90 USDT, within a 24-hour range of 78,522.10 to 80,845.10 USDT, after gaining 1.96%. This advance is stronger than in most comparable periods, indicating that buyers still control the short-term pace. Volume totaled 166,059 BTC versus a historical mean of 159,687 BTC, placing it in a normal range. This means the rise is not volume-starved, but neither has turnover expanded enough to confirm an accelerating breakout. The most important next test is whether volume expands when price clears the intraday high; if it remains ordinary, the odds of repeated rejection will rise.
Price Action and Trend: Momentum Remains Positive, but Extension Raises Pullback Sensitivity
Price deviation stands at +1.59 versus a historical mean of -0.05, higher than about 89% of comparable periods. This measure shows where price sits relative to its recent norm: the current reading confirms trend strength but makes further gains more sensitive to fresh demand. RSI is 59.45; as a gauge of short-term upward and downward momentum, it compares with a historical mean of 49.98 and is higher than about 79% of comparable periods. The MACD histogram is +18.18 USDT, also higher than about 78% of comparable periods. Together, the three signals support a bullish bias without indicating uncontrolled overheating. The next test is whether momentum rises with a new price high; otherwise, elevated deviation may be absorbed through consolidation or a pullback.
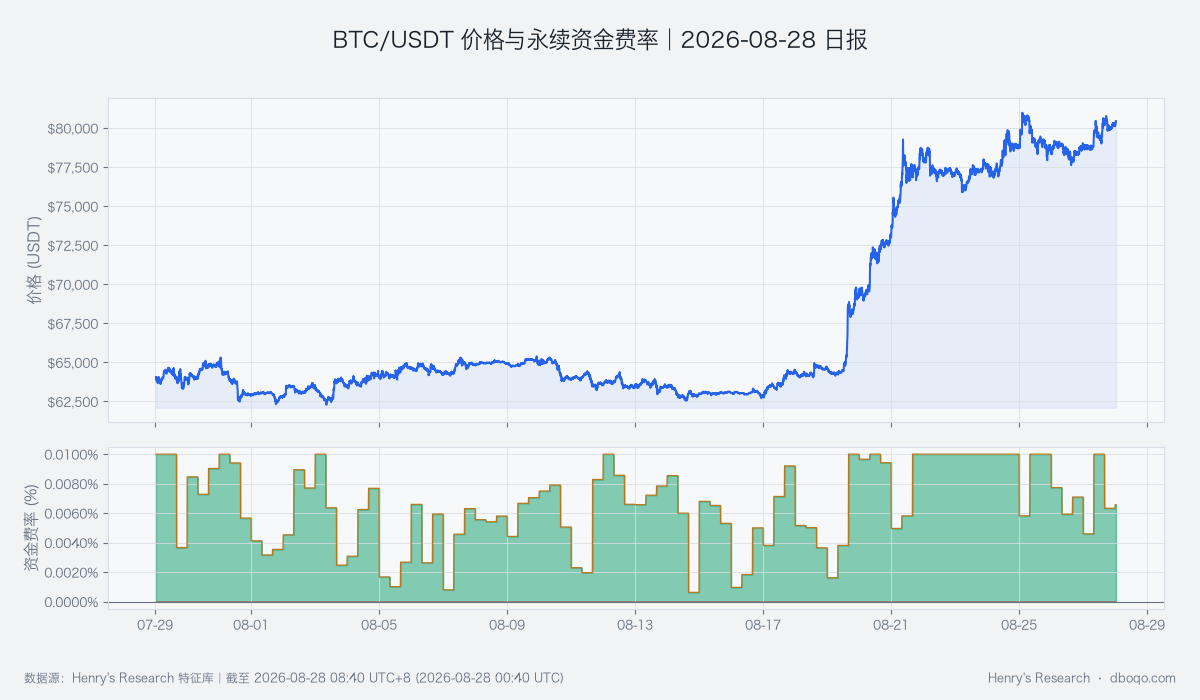
BTC/USDT price and perpetual funding rate over the past 30 days
Price-Volume Structure and Range: Aggressive Buying Has Improved Slightly, but a Breakout Still Needs Incremental Turnover
Aggressive net-buying strength is +0.18 versus a historical mean of -0.09, higher than about 74% of comparable periods, indicating improvement in market buying. Yet the cumulative aggressive buy-minus-sell slope remains -2 BTC versus a historical mean of -12 BTC, leaving the overall reading in a normal range. The price-range position is +0.84 versus a historical mean of +0.49, higher than about 89% of comparable periods, which shows that price is already near the upper part of its recent range. The key test is whether aggressive buying and turnover jointly carry price through 80,845.10 USDT. If price alone probes higher without follow-through demand, the range ceiling is more likely to act as short-term resistance.
Derivatives Dislocation: Elevated Funding Limits the Room for Unconfirmed Upside Chasing
The average funding rate over the past 24 hours is +0.007037%, above the historical mean of +0.002257% and higher than about 86% of comparable periods. Funding measures the payment pressure between the two sides of perpetual contracts; an elevated reading indicates more concentrated bullish demand and raises the need for spot confirmation if price continues higher. The futures basis is -0.04% versus a historical mean of -0.05%. Although better than in most comparable periods, it has not turned positive. The implied-minus-realized volatility spread is +5.76 versus a historical mean of -0.18, showing that options markets price more future movement than has recently occurred. If funding rises further while basis and turnover fail to follow, pullback risk will increase.
Cross-Market and Liquidity Conditions: The Liquidity Pulse Is Warm, While Negative Equity Correlation Weakens External Confirmation
The BTC cross-market capital pulse is warm (+0.46). 5-day ETF flows show a net inflow of USD 11.92 in hundred-million units versus a historical mean net outflow of USD 0.10 in hundred-million units, with only about 18 comparable periods higher than the current reading. 7-day stablecoin supply growth is +0.69%, higher than about 84% of comparable periods, while dollar-index deviation is relatively low; together, these conditions are favorable for risk demand. However, 30-day stablecoin supply growth remains -0.15%, so longer-term liquidity expansion is not yet broad. BTC-equity correlation at -0.201 also means the rally lacks confirmation from traditional risk assets. The warm capital pulse supports a bullish bias, but it is conditional rather than causal; ETF flows and stablecoin growth must persist.
Composite Signal and Scenario Validation: The Bullish Bias Aligns with Liquidity Evidence, but Price-Volume Divergence Would Overturn It
The composite signal is bullish and broadly consistent with price momentum, ETF inflows, stablecoin growth, and a warm capital pulse. The counterweights are negative equity correlation, price near the upper part of its range, and elevated funding. In the base case, price holds near 79,000 USDT and challenges 80,845.10 USDT; an improvement in turnover and aggressive buying would confirm continuation. The adverse case is a breakout without more volume, an expansion in aggressive selling, or a drop below 78,522.10 USDT. Any of these developments would overturn the current bullish view and shift the assessment back toward range-bound or bearish conditions.
Risk Warning: Elevated Prices and Cross-Market Decoupling May Amplify Short-Term Swings
Price is near its 24-hour high, derivatives risk pricing is elevated, and equity correlation sits at a historical low, making the market more sensitive to macro news and changes in liquidity. ETF and stablecoin indicators update at different speeds, so a single reading should not be extrapolated into persistent demand; correlation describes co-movement, not causality. The main variables to monitor are the 78,522.10 to 80,845.10 USDT range, volume, aggressive buying, and funding. Risk allowances should account for a rapid pullback.
Disclaimer: This report was prepared by dboqo using market data available through 2026-08-28 08:40 UTC+8. Cryptocurrency markets are highly volatile. This report is an objective analysis of market conditions only and does not constitute investment advice. Investors must assess risks independently and exercise prudent judgment.