One. Core Finding and Direction: Active Net Buying Strengthens, but Capital Confirmation Is Still Lacking
Data Context: Data are current through 2026-09-03 09:10 UTC+8. The current observation covers the latest 24 hours and is compared with 180 historical 24-hour samples aligned to the same cutoff time. Core Finding: BTC is trading near the top of its recent price range and active net buying has strengthened markedly, yet price gained only +0.09% over 24 hours while external capital and derivatives pricing failed to confirm the move. This looks more like high-level turnover than a completed breakout. Historical Comparison: Active net-buying intensity is +1.18 versus a historical mean of +0.07, with only about 6 of 180 comparable periods higher. The price-range position is +0.96 versus a historical mean of +0.51, with only about 5 periods higher. Buying has clearly pushed price to a rarely seen high, but further gains now require stronger incremental capital. Scope Review: All 13 quality checks passed. No unit, frequency, or magnitude issue was found, and no scope-anomaly candidate had to be excluded from the directional assessment. Directional View: Range-bound. Assessment Horizon: The next 24 hours. Confirmation Conditions: Price must hold above 76,151.90 USDT, active buying must remain positive, and ETF outflows must narrow before high-level turnover can become a sustained advance. Invalidation Conditions: A break below 76,151.90 USDT with active buying turning negative, or a further rise in funding rates without higher spot volume, would shift the range-bound view toward bearish.
Two. Key Market Data: Price Is Flat and Volume Has Not Confirmed a Breakout
BTC last traded at 77,380.00 USDT, within a 24-hour range of 76,151.90 to 77,767.80 USDT, and gained just +0.09%. That is close to the historical mean of +0.07% and remains within normal variation. Volume was 144,904 BTC, slightly below the historical mean of 155,304 BTC and near the middle of comparable periods. Price is close to the top of the range, but total turnover does not show a material expansion in demand. The next test is whether 77,767.80 USDT can be broken and held with volume above the historical mean, rather than merely touched intraday.
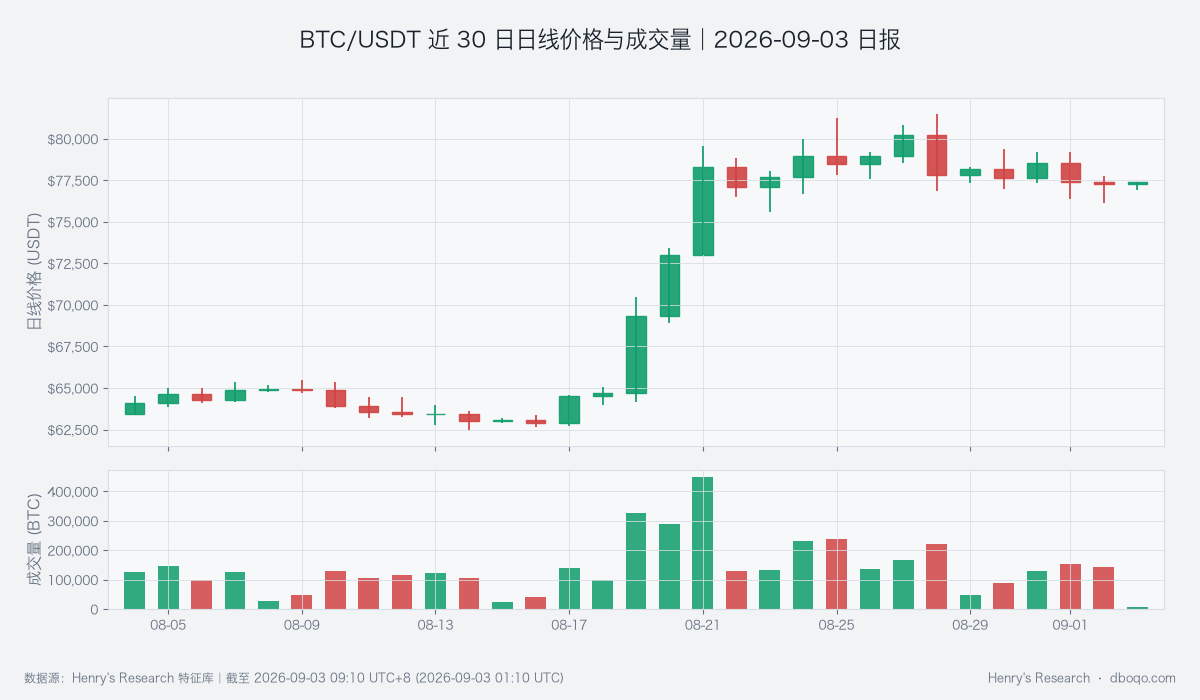
BTC/USDT 30-Day Daily Price and Volume: Price is near the range high, but volume still needs to confirm
Three. Price Action and Trend: Momentum Is Firm, but the Short-Term Trend Has Not Fully Taken Control
RSI is 65.93. RSI measures the relative strength of upward and downward momentum. Its historical mean is 50.50, and only about 14 of 180 comparable periods were higher. Short-term momentum is therefore at a rarely seen high, but this reading alone does not confirm a trend breakout. The MACD histogram is +25.23 USDT versus a historical mean of +1.09 USDT, higher than roughly 82% of comparable periods and supportive of continued rebound inertia. However, the short-term moving-average spread is -31.79 USDT, below its historical mean of +8.25 USDT, showing that the trend structure has not fully strengthened. Continuation becomes more credible only if momentum persists and the short-term moving-average spread turns positive.
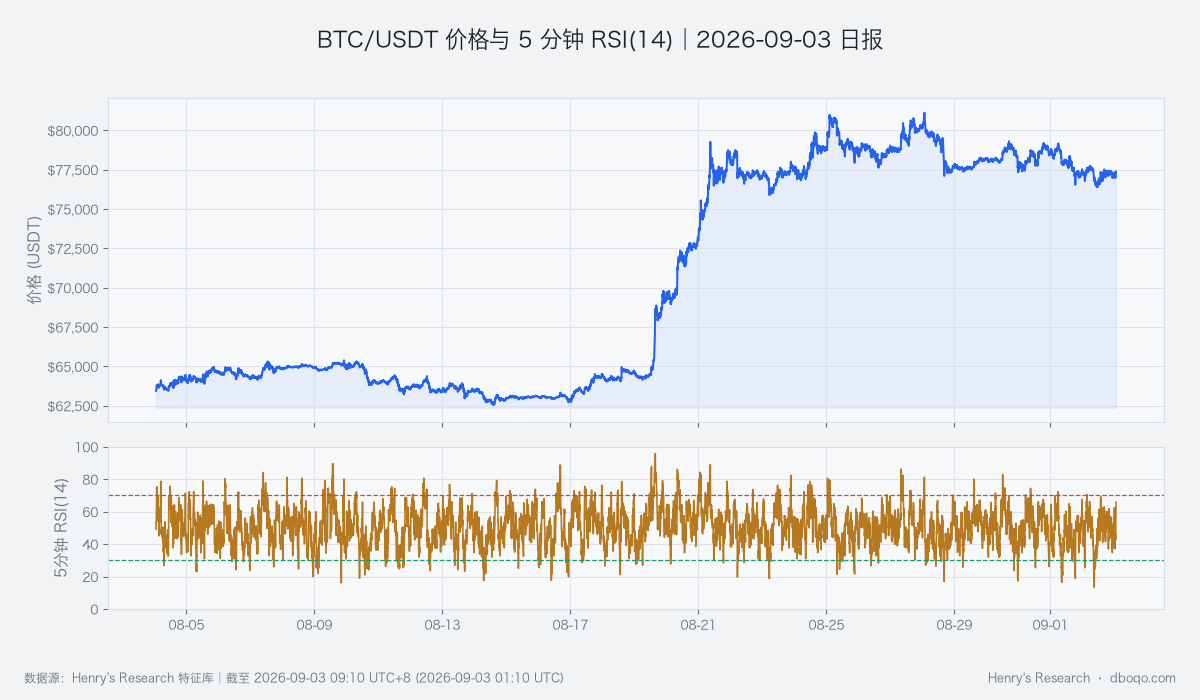
BTC/USDT 30-Day Price and RSI: Momentum is at a rarely seen high; watch whether it becomes trend continuation
Four. Price-Volume Structure and Price Range: Active Buyers Stand Out and Absorption at the High Is Decisive
The cumulative slope of active buying minus active selling is +66 BTC versus a historical mean of -16 BTC, higher than about 72% of comparable periods. The more concentrated active net-buying intensity reached +1.18 versus a historical mean of +0.07, with only about 6 of 180 periods higher. Short-term trading is clearly tilted toward aggressive buyers, but the price-range position has already risen to +0.96 versus a historical mean of +0.51, with only about 5 periods higher. Buyers now face less remaining upside room and greater profit-taking pressure. The next check is whether active buying persists near 77,767.80 USDT rather than fading quickly.
Five. Derivatives Move: Funding Is Elevated and Contract Heat Leads Price
The average funding rate over the latest 24 hours is +0.006567%, well above its historical mean of +0.002510% and higher than about 81% of comparable periods. Funding is the payment exchanged between long and short perpetual-contract participants to keep the contract anchored to spot. A higher rate signals more crowded bullish demand, but the price gain remains only +0.09%, so this heat has not translated into a comparable spot trend. The spot-futures basis is -0.05%, close to its historical mean of -0.05%, and supplies no additional upside confirmation. If funding rises further while price stalls, pullback risk increases; if funding cools while price holds near the high, the structure becomes healthier.
Six. Cross-Market and Capital Flows: The Capital Pulse Is Neutral as ETF Outflows Offset Longer-Term Improvement
The BTC Cross-Market Capital Pulse is neutral. ETF flows show a net outflow of US$4.24 hundred million over the latest 5 days, versus a historical mean net outflow of US$0.27 hundred million, lower than about 66% of comparable periods. Traditional capital channels are therefore not yet supporting short-term buying. By contrast, 30-day stablecoin supply growth is +0.69% versus a historical mean of -0.11%, indicating some improvement in the longer-term digital-asset liquidity base. The Dollar Index at 99.54 and VIX at 15.48 do not imply extreme macro pressure, but BTC's correlation with US equities is -0.133 versus a historical mean of +0.094, with only about 12 of 180 periods as low or lower. This move therefore depends more on crypto-native flows. An improvement in ETF flows is the key condition for the neutral pulse to warm.
Seven. Composite Signal and Scenario Validation: Bullish Evidence Leads, but Not Enough to Overturn the Range View
The composite signal is bullish and agrees with active net buying, MACD momentum, and the high price-range position. Yet it conflicts with unexpanded total volume, continued ETF outflows, and elevated funding rates, so the final view remains range-bound over the next 24 hours. The upside scenario requires a volume-backed break above 77,767.80 USDT, sustained positive active buying, and narrower ETF outflows. The downside scenario would be triggered by a loss of 76,151.90 USDT, active buying turning negative, or continued growth in contract heat without a price advance. Either outcome would overturn the current base case of consolidation within the range.
Eight. Risk Notice
Price is already near a rarely seen range high, where thinner liquidity can produce a rapid spike or reversal. Macro releases, ETF creations and redemptions, and derivatives funding rates can all change within the observation window. Correlation is also at a rarely seen low, meaning US equity direction may not translate directly into BTC. The central checks are price confirmation within 76,151.90 to 77,767.80 USDT and whether active buying, volume, and external capital move together.
Disclaimer: This report was prepared by dboqo using market data available through 2026-09-03 09:10 UTC+8. Cryptocurrency markets are highly volatile. This report is an objective analysis of market conditions only and does not constitute investment advice. Investors must assess risks independently and make prudent decisions.